
Figures & data
Table 1 Ages of the subjects and their scores on the DBAS-16 (mean ± SD, N = 1,333)
Table 2 DBAS-16 total and subscale scores in the different groups
Table 3 Correlations among dependent and independent variables
Figure 1 Distribution of participants with respect to measures for improving sleep quality.
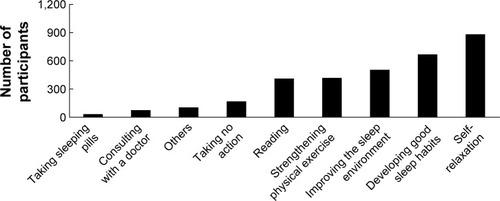
Table 4 PSQI scores in groups with different behaviors related to sleep