Figures & data
Figure 1 Study selection process in this meta-analysis.
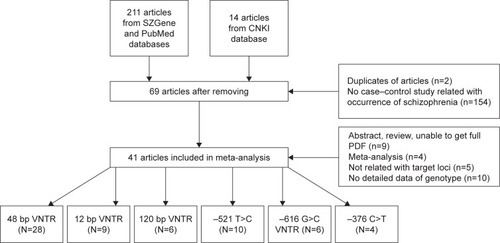
Table 1 Characteristics of studies that qualified to be included in the meta-analysis
Table 2 Allele frequency of 48 bp VNTR polymorphism
Table 3 Pooled associations of DRD4 polymorphisms and schizophrenia
Table 4 Subgroup associations of DRD4 polymorphisms with schizophrenia
Table 5 Genotype distribution and allele frequency of 12 bp TR
Table 6 Genotype distribution and allele frequency of 120 bp TR
Table 7 Genotype distribution and allele frequency of −521 C>T
Table 8 Genotype distribution and allele frequency of −616 C>G
Table 9 Genotype distribution and allele frequency of −376 C>T
Figure 2 Funnel plot analysis for the detection of publication bias in the association between the 48 bp VNTR (7R vs others) and schizophrenia.
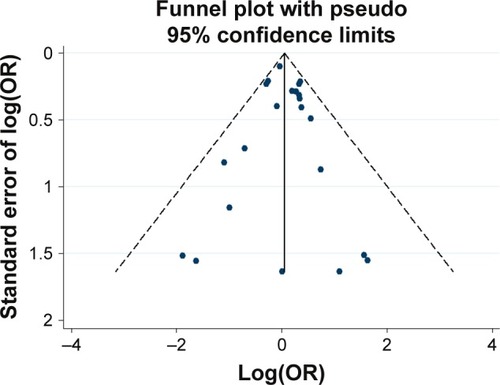
Figure 3 Funnel plot analysis for the detection of publication bias in the association between 48 bp VNTR (L vs S) and schizophrenia.
Abbreviations: OR, odds ratio; VNTR, variable number tandem repeat.
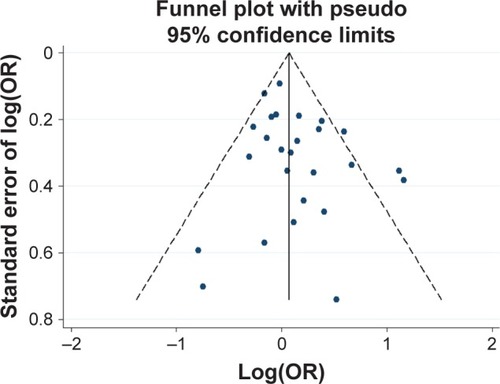
Figure 4 Funnel plot analysis for the detection of publication bias in the association between 12 bp TR and schizophrenia.
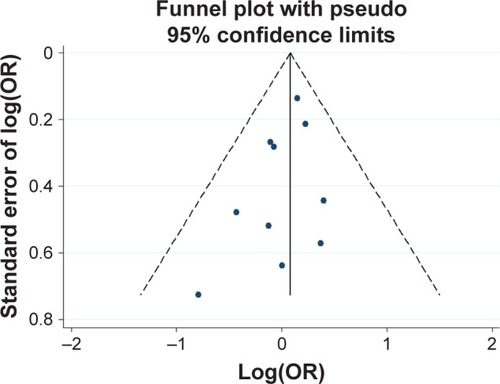
Figure 5 Funnel plot analysis for the detection of publication bias in the association between 120 bp TR and schizophrenia.
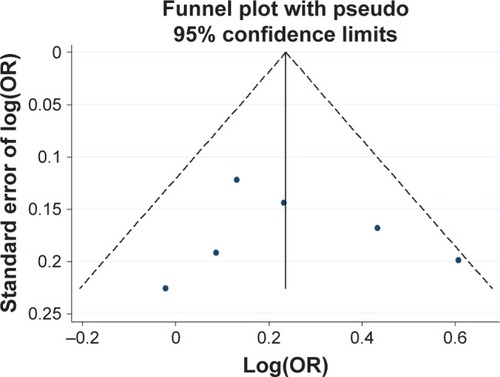
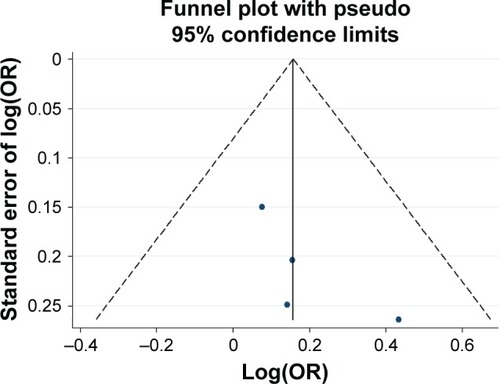
Figure 6 Funnel plot analysis for the detection of publication bias in the association between −521 C>T and schizophrenia.
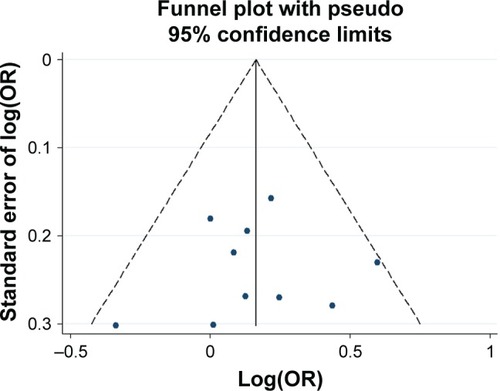
Figure 7 Funnel plot analysis for the detection of publication bias in the association between −616 C>G and schizophrenia.
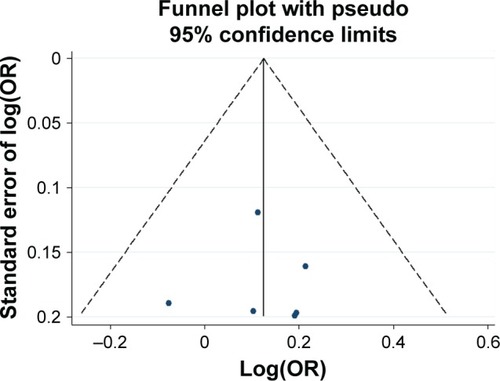
Figure 8 Funnel plot analysis for the detection of publication bias in the association between −376 C>T and schizophrenia.