
Figures & data
Table 1 Baseline biologic parameters of the study population
Table 2 Schedule of neuropsychological assessments taken into analysis
Figure 1 Number of correct responses and errors committed in SRT tests.
Notes: (A) The X-axis indicates the time point of battery test execution. The Y-axis indicates the analyzed results of the test (number of correct responses in that case). Attempts in SRT test in which statistically significant effect of sleep deprivation on correct responses was observed using repeated measures ANOVA. Statistically significant differences in the number of correct responses between particular time points revealed by the post hoc Bonferroni correction are marked with double asterisks (p<0.05). Errors bars indicate SE. (B) Statistically significant differences in the number of errors committed between particular time points revealed by the post hoc Bonferroni correction are marked with double asterisks (p<0.05). Interestingly, differences in the number of committed errors among three attempts in SRT are the lowest in the last time point.
Abbreviations: ANOVA, analysis of variance; SE, standard error; SRT, simple reaction time; TSD, total sleep deprivation.
Abbreviations: ANOVA, analysis of variance; SE, standard error; SRT, simple reaction time; TSD, total sleep deprivation.
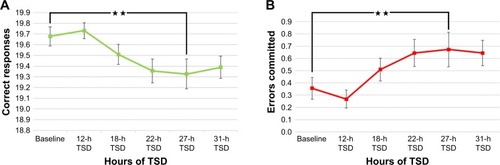
Figure 2 Reaction time in SRT and CRT tests.
Notes: (A) No statistically significant (p>0.05) effects of TSD on reaction time or on the correct reaction time (results not shown) in SRT test were observed. Interestingly, an opposite trend could be observed, that is, the reaction times tend to be lower (improved) in the following attempts. (B) Statistically significant effect of TSD on the reaction time in correct and all responses in CRT test was observed using repeated measures ANOVA (p<0.05). The greatest reaction time was obtained in the first time point of TSD.
Abbreviations: ANOVA, analysis of variance; CRT, choice reaction time; SRT, simple reaction time; TSD, total sleep deprivation.
Abbreviations: ANOVA, analysis of variance; CRT, choice reaction time; SRT, simple reaction time; TSD, total sleep deprivation.
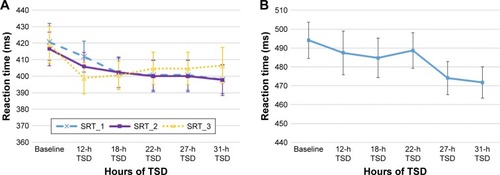
Figure 3 Number of errors committed in delayed matching to sample (DMS) test.
Notes: Statistically significant effect of TSD on the number of committed errors in DMS test was observed using repeated measures ANOVA (p<0.05). Interestingly, the last time point was characterized by the lowest mean number of committed errors.
Abbreviations: ANOVA, analysis of variance; TSD, total sleep deprivation.
Abbreviations: ANOVA, analysis of variance; TSD, total sleep deprivation.
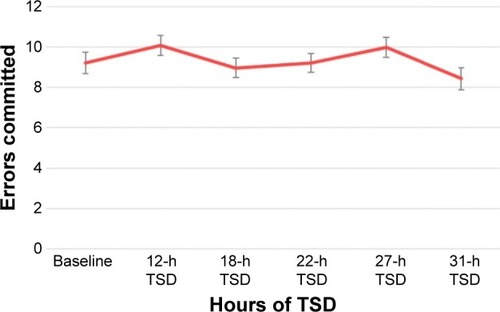
Figure 4 Number of correct responses in CRT test.
Notes: Statistically significant differences in the number of correct responses between particular time points revealed by the post hoc Bonferroni correction are marked with double asterisks (p<0.05). The lowest number of correct responses was obtained in the first time point of TSD.
Abbreviations: ANOVA, analysis of variance; CRT, choice reaction time; TSD, total sleep deprivation.
Abbreviations: ANOVA, analysis of variance; CRT, choice reaction time; TSD, total sleep deprivation.
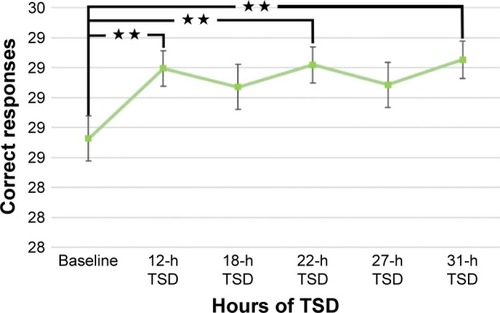
Figure 5 Reaction time in VAT.
Notes: Statistically significant differences in the reaction time between particular time points revealed by the post hoc Bonferroni correction are marked with double asterisks (p<0.05). Interestingly, VAT reaction times for all responses tend to decrease in the second, third, and fourth time points in TSD, while the reaction time in the last three time points tend to be at a relatively constant level.
Abbreviations: TSD, total sleep deprivation; VAT, visual attention test.
Abbreviations: TSD, total sleep deprivation; VAT, visual attention test.
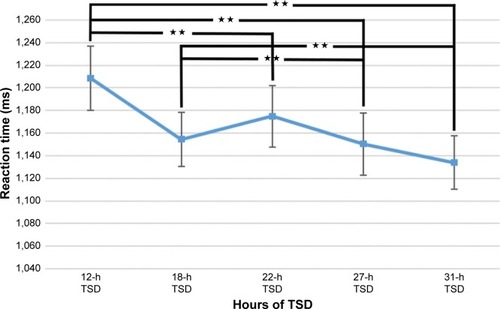
Table S1 Mean, min, max, SD, and SE values