
Figures & data
Figure 1 Eligibility of studies for inclusion in meta-analysis.
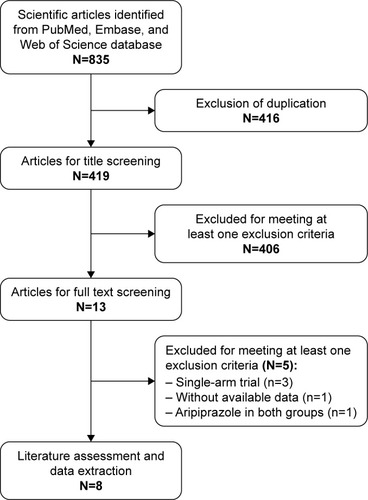
Table 1 Baseline characteristics of patients in the trials included in the meta-analysis
Figure 2 Risk of bias summary.
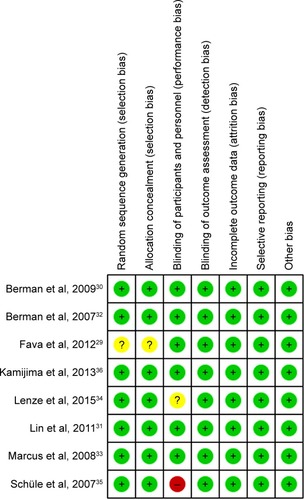
Table 2 GRADE evidence profile
Figure 3 Forest plot showing the effect of adjunctive aripiprazole on remission rate.
Abbreviations: CI, confidence interval; RR, risk ratio.
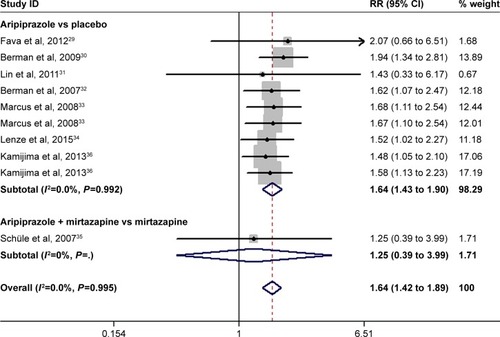
Figure 4 Forest plot showing the effect of adjunctive aripiprazole on response rate.
Note: Weights are from random effects analysis.
Abbreviations: CI, confidence interval; RR, risk ratio.
Abbreviations: CI, confidence interval; RR, risk ratio.
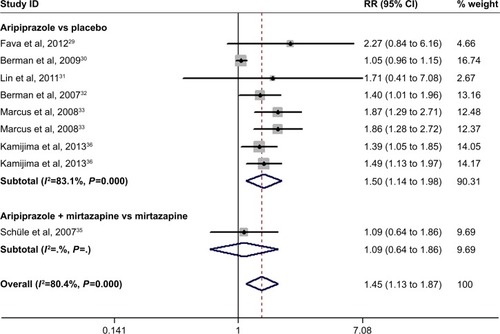
Figure 5 Forest plot showing the effect of adjunctive aripiprazole on change from baseline in MADRS score.
Abbreviations: CI, confidence interval; MADRS, Montgomery–Asberg Depression Rating Scale; WMD, weight mean difference.
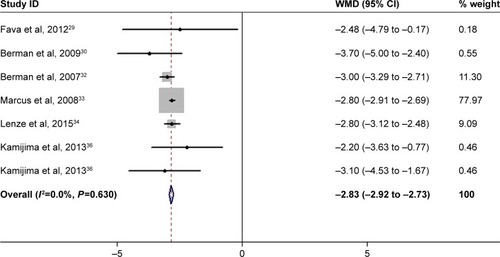
Figure 6 Forest plot showing the effect of adjunctive aripiprazole on changes from baseline in CGI-I and CGI-S scores.
Note: Weights are from random effects analysis.
Abbreviations: CGI-I, Clinical Global Impression-improvement; CGI-S, Clinical Global Impression-severity; CI, confidence interval; WMD, weight mean difference.
Abbreviations: CGI-I, Clinical Global Impression-improvement; CGI-S, Clinical Global Impression-severity; CI, confidence interval; WMD, weight mean difference.
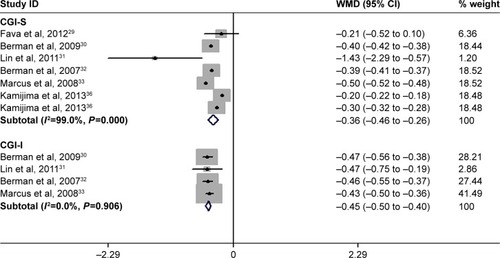
Table 3 Summary of the RRs with 95% CIs of adverse events