Figures & data
Figure 1 PRISMA flowchart of the study selection.
Abbreviation: OCD, obsessive–compulsive disorder.
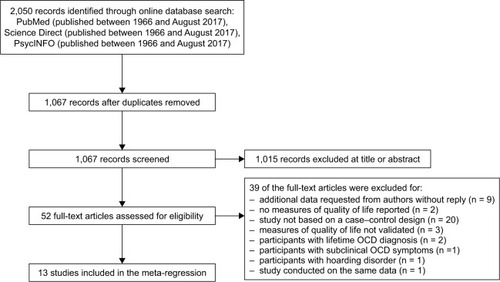
Table 1 Characteristics of the studies included in the meta-analysis (n = 13)
Figure 2 Forest plot between groups with OCD and controls on global QOL (n = 13).
Abbreviations: CI, confidence interval; OCD, obsessive–compulsive disorder; PQL, Pediatric Quality of Life Inventory – Child Report; QOL, quality of life; SMD, standardized mean difference.
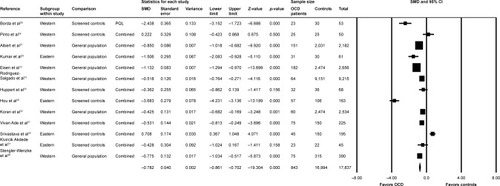
Figure 3 Funnel plot of publication bias for the meta-analysis between groups with OCD and controls on global QOL.
Abbreviations: OCD, obsessive–compulsive disorder; QOL, quality of life; SMD, standardized mean difference.
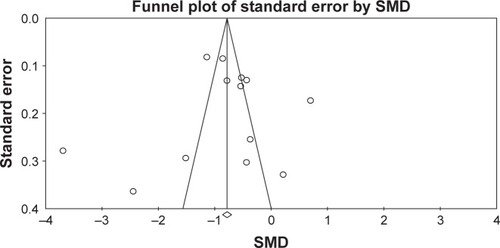
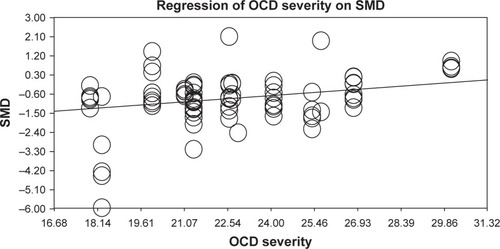
Figure 4 Meta-regression of global QOL as a function of OCD severity.
Abbreviations: OCD, obsessive–compulsive disorder; QOL, quality of life; SMD, standardized mean difference.