
Figures & data
Figure 1 Patient disposition (≤1 week versus >1 week).
Notes: Per protocol group, included all patients without a major protocol deviation; values are n (%).
Abbreviation: ITT, intent-to-treat.
Abbreviation: ITT, intent-to-treat.
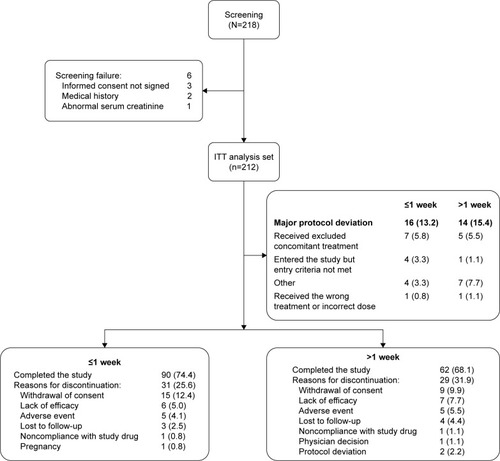
Table 1 Demographics and baseline characteristics (ITT population)
Table 2 Distribution of time to treatment initiation
Figure 2 Difference in mean change in PANSS total score at various time points.
Notes: All values are least square means (standard error); *P≤0.05; difference between subgroups, ≤1 week minus >1 week.
Abbreviations: CI, confidence interval; PANSS, positive and negative syndrome scale.
Abbreviations: CI, confidence interval; PANSS, positive and negative syndrome scale.
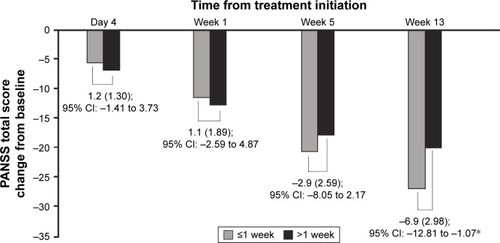
Table 3 Change from baseline to each time point within subgroups
Figure 3 PANSS responder rates (.30%) at various time points.
Note: **P≤0.01 for difference in PANSS responder rates between the subgroups.
Abbreviation: PANSS, positive and negative syndrome scale.
Abbreviation: PANSS, positive and negative syndrome scale.
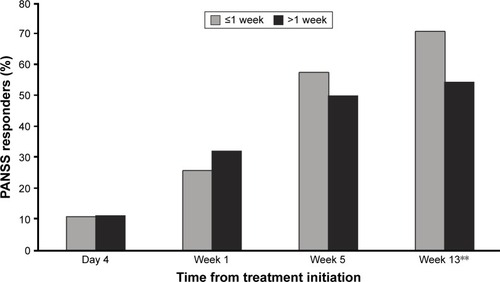
Table 4 Changes from baseline to week 13 in the secondary endpoints
Table 5 Categorical summary of clinical global impression-severity and personal and social performance scores
Figure 4 Summary of readiness for hospital discharge.
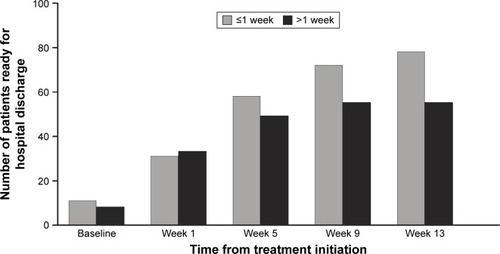
Table 6 Summary of treatment-emergent adverse events
Table S1 Institutional Review Board/Committees