Figures & data
Figure 1 Flow diagram summarizing the process of enrollment and follow-up.
Abbreviation: SDO, suicidal drug overdose.
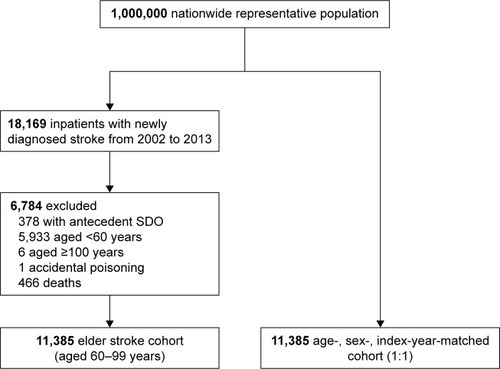
Table 1 Demographic profile of study patients (N=22,770)
Figure 2 Cumulative incidence of SDO in elder patients with stroke and the matched cohort.
Abbreviation: SDO, suicidal drug overdose.
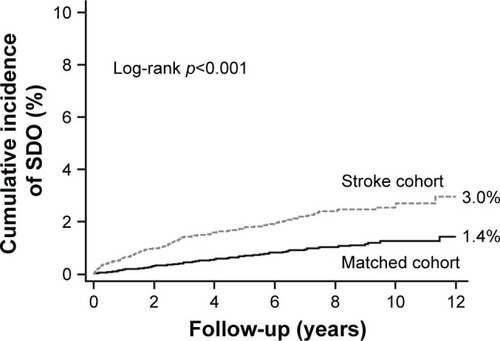
Figure 3 Cumulative incidence of SDO in elder stroke patients with different stroke attacks.
Abbreviation: SDO, suicidal drug overdose.
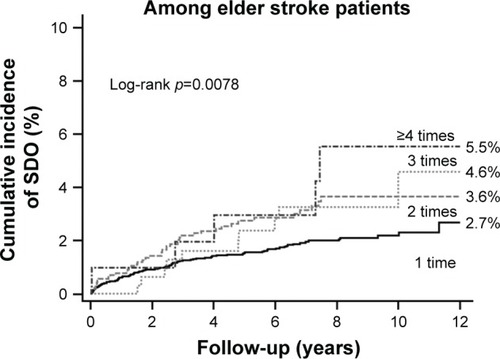
Table 2 Incidences and HRs for SDO following stroke (2002–2012, N=22,770)
Figure 4 Cumulative incidence of SDO in four groups: poststroke depression, prestroke depression, stroke without depression, and nonstroke-matched control groups.
Abbreviation: SDO, suicidal drug overdose.
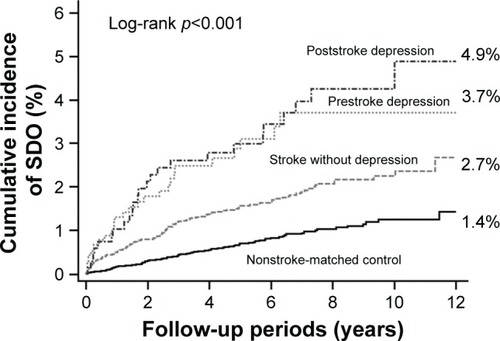
Table 3 Univariate and multivariate survival analyses for factors associated with SDO in patients with stroke
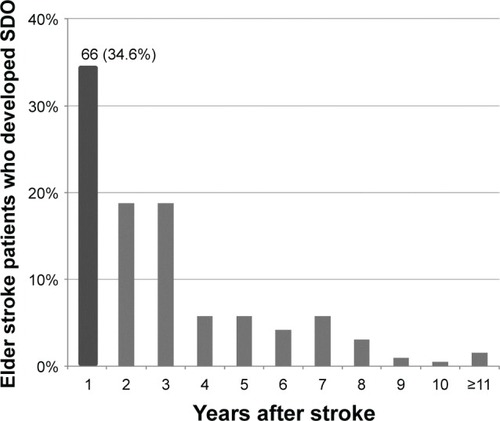
Figure 5 Follow-up duration among 191 elder stroke patients who developed SDO.
Abbreviation: SDO, suicidal drug overdose.