
Figures & data
Figure 1 Flow diagram indicating the process of selecting literature for meta-analysis.
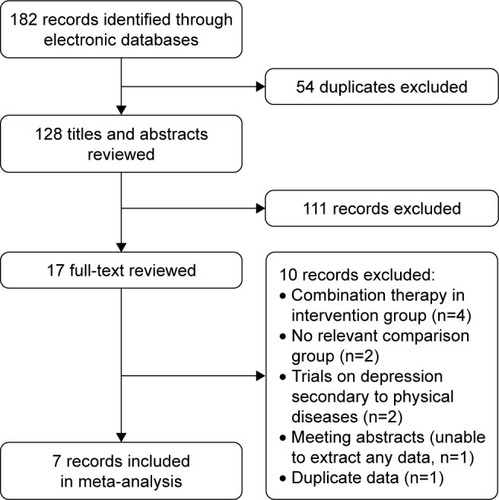
Figure 2 Quality assessments for each included study.
Notes: “+” means “low bias”, “−” means “high bias”, and “?” means “unclear bias”.
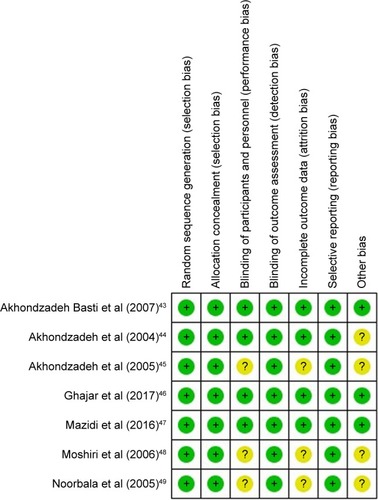
Table 1 Characteristics of the seven included studies
Figure 3 Meta-analyses of primary outcomes: (A) improvement of depression symptoms compared with placebo; (B) improvement of depression symptoms compared with synthetic antidepressants.
Abbreviations: CI, confidence interval; IV, inverse variation; SD, standard deviation; Std, standard.
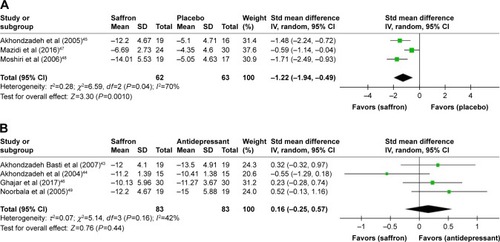
Figure 4 Results for subgroup analyses of primary outcomes: (A) subgroup analysis in studies compared with placebo, stratified by treatment dosage, duration, and outcome measures; (B) subgroup analysis in studies compared with synthetic antidepressants, stratified by type of antidepressants.
Abbreviations: BDI, Beck Depression Inventory; CI, confidence interval; HAMD, Hamilton Depression Rating Scale; IV, inverse variation; SD, standard deviation; SSRIs, selective serotonin reuptake inhibitors; Std, standard; TCAs, tricyclic antidepressants.
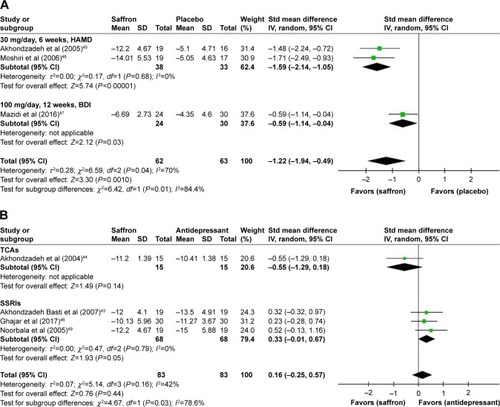
Table 2 Meta-analyses of secondary outcomes