
Figures & data
Figure 1 (A, B) Histologic views of exfoliative cell samples. (C) Stereological formulas.
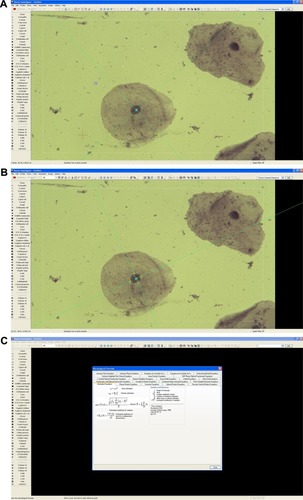
Table 1 Sociodemographic data of the patients
Table 2 NV and CV values according to AD stages
Table 3 NV and CV values according to PD stages
Table 4 Cytometric analysis results in AD patients, PD patients, and controls