Figures & data
Table 1 Characteristics of alcohol-dependent subjects and healthy controls
Figure 1 Compared to healthy controls, alcohol-dependent subjects showed altered ReHo areas.
Note: The red color represents an increased ReHo area, and the blue color represents a decreased ReHo area.
Abbreviations: L, left; R, right; ReHo, regional homogeneity.
Abbreviations: L, left; R, right; ReHo, regional homogeneity.
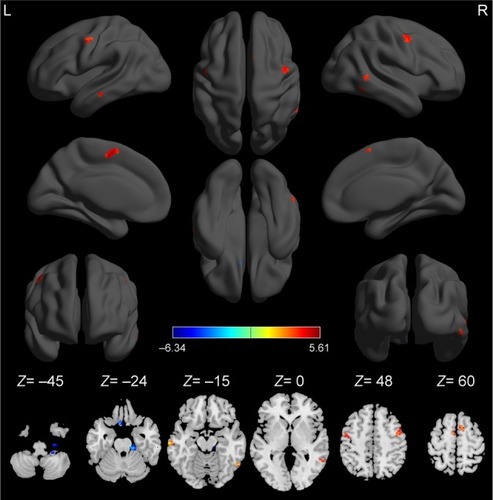
Figure 2 Mean beta value of ReHo differences in regional brain areas.
Note: Significant differences were found for beta value of all ReHo brain areas between alcohol-dependent subjects and healthy controls (p < 0.001).
Abbreviations: CAL, cerebellum anterior lobe; CPL, cerebellum posterior lobe; ITG, inferior temporal gyrus; L, left; MFG, medial frontal gyrus; MTG, middle temporal gyrus; PG, precentral gyrus; R, right; ReHo, regional homogeneity; RG, rectal gyrus; SFG, superior frontal gyrus.
Abbreviations: CAL, cerebellum anterior lobe; CPL, cerebellum posterior lobe; ITG, inferior temporal gyrus; L, left; MFG, medial frontal gyrus; MTG, middle temporal gyrus; PG, precentral gyrus; R, right; ReHo, regional homogeneity; RG, rectal gyrus; SFG, superior frontal gyrus.
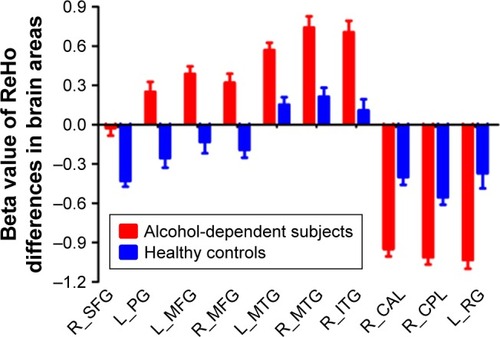
Table 2 Binarized degree centrality differences between alcohol-dependent subjects and healthy controls
Figure 3 ROC curve analysis of ReHo differences in regional brain areas.
Notes: ROC curve for differences in higher ReHo (A) and lower ReHo (B) in brain areas.
Abbreviations: CAL, cerebellum anterior lobe; CPL, cerebellum posterior lobe; ITG, inferior temporal gyrus; L, left; MFG, medial frontal gyrus; MTG, middle temporal gyrus; PG, precentral gyrus; R, right; ReHo, regional homogeneity; RG, rectal gyrus; ROC, receiver operating characteristic; SFG, superior frontal gyrus.
Abbreviations: CAL, cerebellum anterior lobe; CPL, cerebellum posterior lobe; ITG, inferior temporal gyrus; L, left; MFG, medial frontal gyrus; MTG, middle temporal gyrus; PG, precentral gyrus; R, right; ReHo, regional homogeneity; RG, rectal gyrus; ROC, receiver operating characteristic; SFG, superior frontal gyrus.
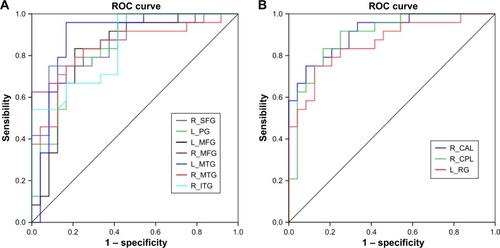
Table 3 ROC curve for the ReHo differences in brain areas between alcohol-dependent subjects and healthy controls
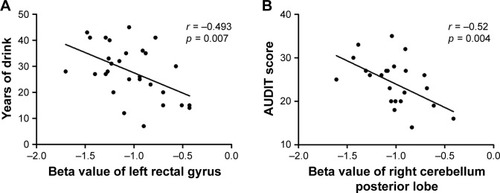
Figure 4 Pearson correlation between behavioral performances and beta value of ReHo differences in brain areas.
Notes: Years of drink (A) and AUDIT score (B) showed correlations with altered ReHo brain areas.
Abbreviations: AUDIT, alcohol use disorders identification test; ReHo, regional homogeneity.
Abbreviations: AUDIT, alcohol use disorders identification test; ReHo, regional homogeneity.