
Figures & data
Table 1 Level of attention demand of dual-tasks in MDTT
Figure 1 Flow chart of study pathway.
Abbreviations: MDTT, Musical Dual-Task Training; TMT, Trail Making Test; TUG, Timed Up and Go; FES-I, Falls Efficacy Scale International; CMAI-C, Cohen-Mansfield Agitation Inventory scale, Chinese community-version.
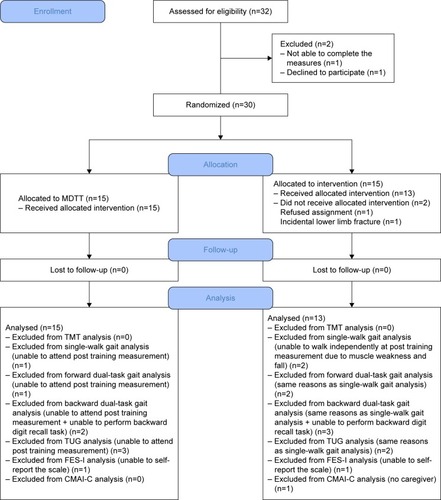
Table 2 Baseline characteristics and pretests of outcome measurements
Figure 2 TMT part A for the MDTT and control groups at the pretest and posttest assessments.
Abbreviations: TMT, Trail Making Test; MDTT, Musical Dual-Task Training.
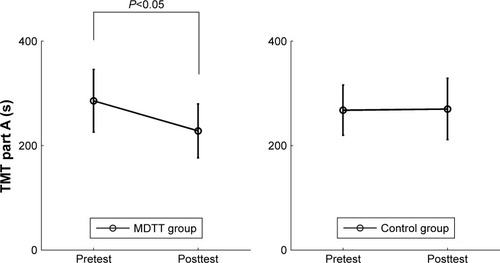
Table 3 Changes in the primary outcome measurement, TMT part A, between the pretest and posttest assessments
Table 4 Changes in physical outcomes including walking, stride length, corresponding DTCs, and balance
Table 5 Changes in falls efficacy and agitation