Figures & data
Figure 1 Obvious differences in gut microbial composition between female MDD patients and HCs.
Notes: (A) Three-dimensional principal-coordinate analysis; (B) partial least squares-discriminant analysis.
Abbreviations: MDD, major depressive disorder; HCs, healthy controls.
Abbreviations: MDD, major depressive disorder; HCs, healthy controls.
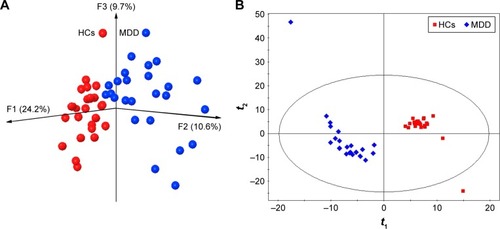
Figure 2 Obvious differences in gut microbial composition between male MDD patients and HCs.
Notes: (A) Three-dimensional principal-coordinate analysis; (B) partial least squares-discriminant analysis.
Abbreviations: MDD, major depressive disorder; HCs, healthy controls.
Abbreviations: MDD, major depressive disorder; HCs, healthy controls.
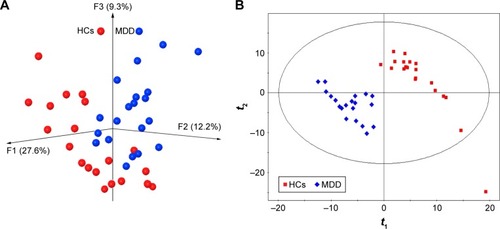
Figure 3 Heat map of differential operational taxonomic unit abundance between female MDD patients and HCs.
Notes: Assignment of each operational taxonomic unit provided at right. Green and red indicate increase and decrease, respectively.
Abbreviations: MDD, major depressive disorder; HCs, healthy controls.
Abbreviations: MDD, major depressive disorder; HCs, healthy controls.
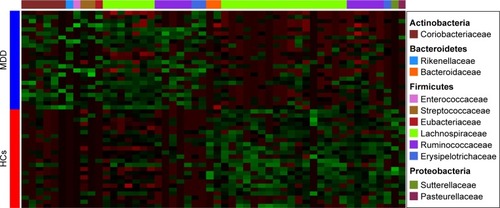
Figure 4 Heat map of differential operational taxonomic unit abundance between male MDD patients and HCs.
Notes: Assignment of each operational taxonomic unit provided at right. Green and red indicate increase and decrease, respectively.
Abbreviations: MDD, major depressive disorder; HCs, healthy controls.
Abbreviations: MDD, major depressive disorder; HCs, healthy controls.
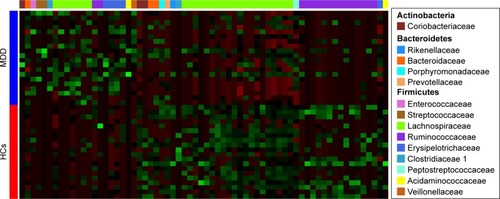
Figure 5 Taxonomic differences in gut microbiota in female subjects.
Notes: (A) Bacterial clades (25) with statistically significant and biologically consistent differences in female MDD patients and HCs (LDA score >2); (B) MDD-enriched taxa indicated by positive LDA scores (green), and HC-enriched taxa indicated by negative scores (red).
Abbreviations: MDD, major depressive disorder; HCs, healthy controls; LDA, linear discriminant analysis.
Abbreviations: MDD, major depressive disorder; HCs, healthy controls; LDA, linear discriminant analysis.
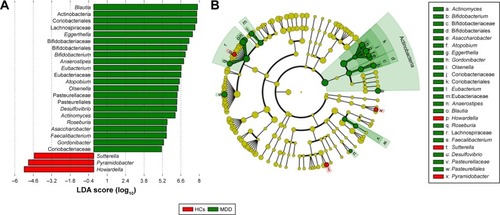
Figure 6 Taxonomic differences in gut microbiota in male subjects.
Notes: (A) Twelve bacterial clades with statistically significant and biologically consistent differences in male MDD patients and HCs (LDA score >2); (B) MDD-enriched taxa indicated by positive LDA scores (green), and HC-enriched taxa indicated by negative scores (red).
Abbreviations: MDD, major depressive disorder; HCs, healthy controls; LDA, linear discriminant analysis.
Abbreviations: MDD, major depressive disorder; HCs, healthy controls; LDA, linear discriminant analysis.
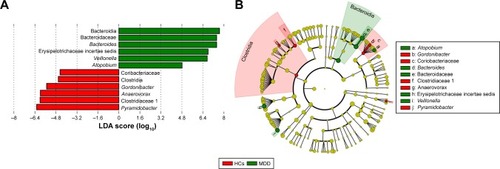
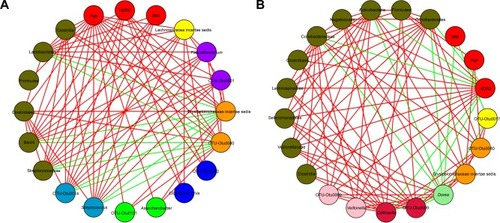
Figure 7 Associations among demographic data (age, BMI, and HDRS) and gut microbiota.
Notes: (A) Female and (B) male MDD patients. Red lines indicate positive relationships, green lines negative relationship, and circles: red, demographic data; green, Asaccharobacter; blue, Clostridium XIVa; orange, Erysipelotrichaceae incertae sedis; dark orchid, Faecalibacterium; yellow, Lachnospiraceae incertae sedis; deep sky blue, Streptococcus; crimson, Collinsella; light green, Dorea; pink, Veillonella; olive, others.
Abbreviations: BMI, body-mass index; HDRS, Hamilton Depression Rating Scale; MDD, major depressive disorder.
Abbreviations: BMI, body-mass index; HDRS, Hamilton Depression Rating Scale; MDD, major depressive disorder.