Figures & data
Table 1 Baseline patient characteristics by initial treatment
Table 2 Outcomes at 24 weeks by medication started at baseline, overall sample
Table 3 Estimated adjusted effect of initial treatment on QIDS-SR16, CGI-S, and SDS (MMRM model)
Table 4 Estimated adjusted effect of initial treatment on clinical remission, functional remission, and recovery (GEE logistic model)Table Footnotea
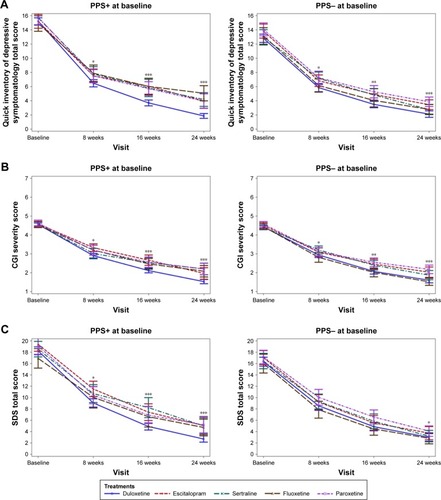
Figure 1 Change in (A) QIDS-SR16, (B) CGI-S, and (C) SDS over follow-up by treatment and PPS status at baseline. Notes: *p<0.05; **p<0.001; ***p<0.0001. Statistical comparisons are conducted across treatment cohorts.
Abbreviations: CGI-S, Clinical Global Impression-Severity; PPS, painful physical symptoms; QIDS-SR16, 16-item Quick Inventory of Depressive Symptomatology Self-Report; SDS, Sheehan Disability Scale.