
Figures & data
Table 1 Demographics of the African American cohort in the study
Figure 1 Survival curves for age of first use of cannabis, in all participants with the PDYN SS+SL genotype, compared to the LL genotype.
Note: Data are stratified by gender: (A) males; (B) females.
Abbreviations: LL, long–long; NS, not significant; PDYN, prodynorphin; SL, short–long; SS, short–short.
Abbreviations: LL, long–long; NS, not significant; PDYN, prodynorphin; SL, short–long; SS, short–short.
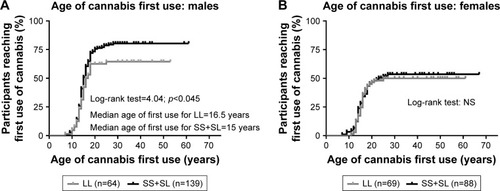
Figure 2 Number of participants who reported any lifetime use of cannabis, versus no lifetime use of cannabis, in the PDYN SS+SL genotype, compared to the LL genotype.
Note: Data are stratified by gender: (A) males; (B) females.
Abbreviations: LL, long–long; NS, not significant; PDYN, prodynorphin; SL, short–long; SS, short–short.
Abbreviations: LL, long–long; NS, not significant; PDYN, prodynorphin; SL, short–long; SS, short–short.
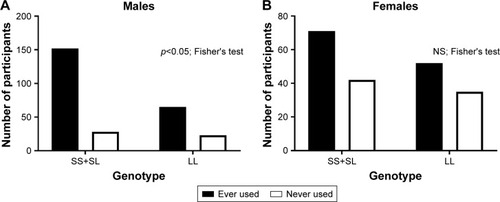
Figure 3 Number of participants in the “low”, “medium”, and “high” cannabis exposure bins, in the PDYN SS+SL genotype, compared to the LL genotype.
Notes: The bins were composed of participants with cannabis KMSK scores of 0–4, 5–9, and 10–14, respectively. The “high”-exposure bin contains all cannabis KMSK scores greater than or equal to the cut point for optimal concurrent validity with the DSM IV cannabis-dependence diagnosis. Data are stratified by gender: (A) males; (B) females.
Abbreviations: DSM IV, Diagnostic and Statistical Manual of Mental Disorders–IV; KMSK, Kreek–McHugh–Schluger–Kellogg; LL, long–long; NS, not significant; PDYN, prodynorphin; SL, short–long; SS, short–short.
Abbreviations: DSM IV, Diagnostic and Statistical Manual of Mental Disorders–IV; KMSK, Kreek–McHugh–Schluger–Kellogg; LL, long–long; NS, not significant; PDYN, prodynorphin; SL, short–long; SS, short–short.
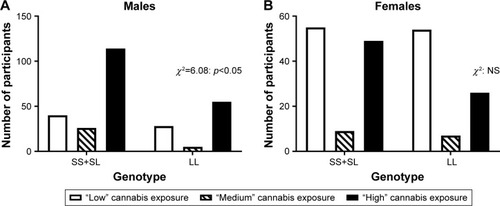
Table S1 Chi-square test on grouped PDYN genotype distribution in total and gender-specific African American groups