
Figures & data
Table 1 Demographic and clinical characteristics of controls and patients
Figure 1 Task design.
Notes: (A) The task composition. During rest periods as control conditions, subjects continued to draw “○” and “×” for 60 seconds. During task periods, subjects drew an imagined tree or copied an illustration of a tree for 60 seconds. Each task was repeated four times. (B) The detail of periods in the baseline processing. Blue arrows show the pre-task baseline. Orange arrows show the post-task baseline. (C) A typical waveform of [oxy-Hb] in a healthy subject during the free-drawing task.
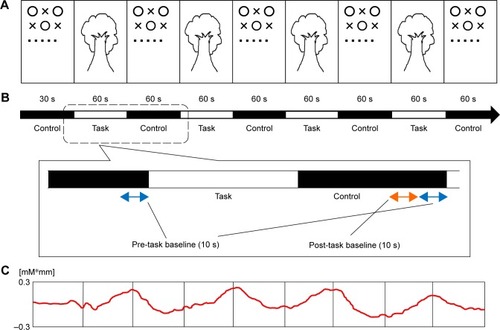
Figure 2 Examples of tree-drawings.
Notes: (A) A typical example of a tree illustration as a model in the copying task. (B) Typical examples of drawings made by a healthy subject and a patient in the free-drawing and copying tasks.
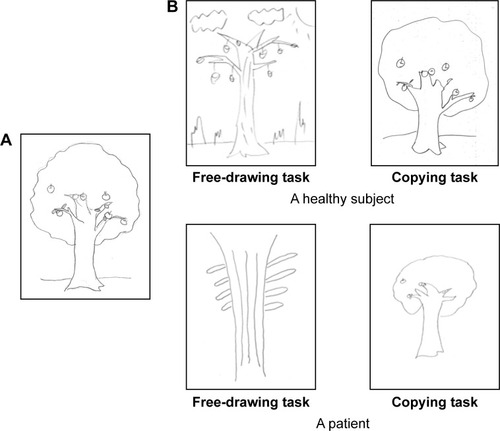
Figure 3 NIRS measurement and analysis.
Notes: (A) The probe holder worn by a patient. The jaw was fixed using a chin stand to prevent changes in blood flow due to the head movement. (B) Data were calculated from the mean wave of changes in [oxy-Hb]. We calculated the area of the waveform of changes in [oxy-Hb] during 60 seconds as the task period and used values of this area as NIRS data. (C) Location of channels and ROIs. ROIs are left Ch19 and right Ch22; frontal pole regions, left Ch11 and right Ch12; middle frontal regions, left Ch20 and right Ch21; inferior frontal regions, left Ch9 and right Ch5; inferior parietal regions, left Ch22 and right Ch19; superior temporal regions. ROIs are shown by yellow channels.
Abbreviations: ROI, region of interest; NIRS, near-infrared spectroscopy; [oxy-Hb], oxygenated hemoglobin.
Abbreviations: ROI, region of interest; NIRS, near-infrared spectroscopy; [oxy-Hb], oxygenated hemoglobin.
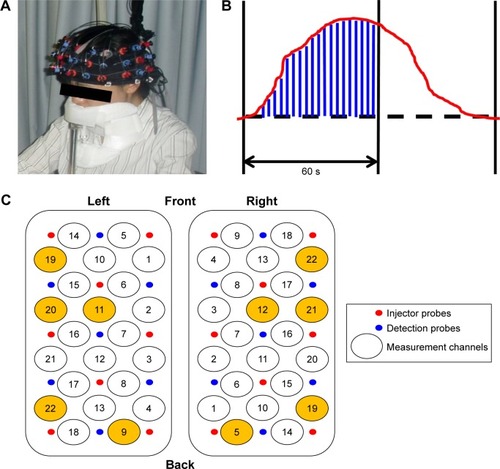
Figure 4 Average waveforms in the region of interest where significant differences were observed between controls and patients.
Notes: (A) Average waveforms during the free-drawing task in each group. (B) Average waveforms during the copying task in each group. The red lines represent controls, and the blue lines represent patients. Green numbers surrounded by the red circles indicate channels where the significant difference is observed, and they correspond to each figure of waveform. The longitudinal axis indicates the task period from 0 to 60 seconds, and the rest period from 60 to 120 seconds.
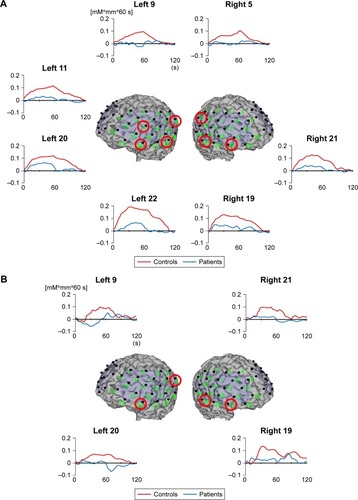
Figure 5 δ[oxy-Hb] in regions showing significant differences in groups or conditions.
Notes: The blue bars represents controls, and the red bars represent patients. Left two bars show δ[oxy-Hb] during the free-drawing task; right two bars show δ[oxy-Hb] during the copying task. Error bars indicate ±1 standard error. Significance *P<0.05, **P<0.01, ***P<0.001.
Abbreviation: [oxy-Hb], oxygenated hemoglobin.
Abbreviation: [oxy-Hb], oxygenated hemoglobin.
![Figure 5 δ[oxy-Hb] in regions showing significant differences in groups or conditions.](/cms/asset/7217275c-bdfc-4272-9df0-e67b6eaa9395/dndt_a_159984_f0005_c.jpg)
Figure 6 Scatter diagrams of regions showing significant correlations between δ[oxy-Hb] and Positive and Negative Symptom Scale scores.
Abbreviation: [oxy-Hb], oxygenated hemoglobin.
![Figure 6 Scatter diagrams of regions showing significant correlations between δ[oxy-Hb] and Positive and Negative Symptom Scale scores.](/cms/asset/ffc15096-f1d9-4470-8ea3-eb2d2b9b55f3/dndt_a_159984_f0006_b.jpg)