Figures & data
Table 1 Demographic characteristics of controls and cases
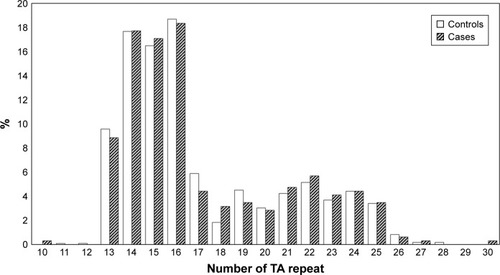
Figure 1 Genomic structure and approximate locations of the variants investigated through case–control analysis or identified from resequencing of (A) ESR1 and (B) ESR2.
Abbreviations: UTR, untranslated region; ESR1, estrogen receptor α; ESR2, estrogen receptor β.
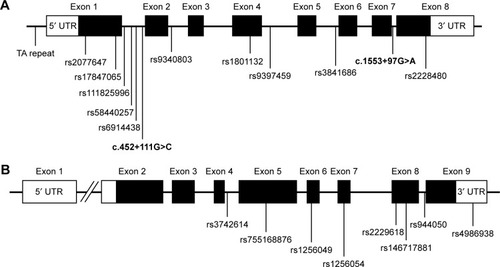
Table 2A ESR1 variants detected by sequencing and allelic frequencies
Table 2B ESR2 variants detected by sequencing and allelic frequencies
Table 3 Genotype distributions for controls and cases for genotyped polymorphisms
Figure 2 Distribution of estrogen receptor α (ESR1) TA repeat alleles for controls and cases.