Figures & data
Figure 1 (A) Sucrose preference (%). (B–F) Open field test and EPM test results. (B) Distance in the open arm. (C) Time spent in the open arm. (D) Distance traveled in the center. (E) Immobility time in the center. (F) Rearing. *p<0.05.
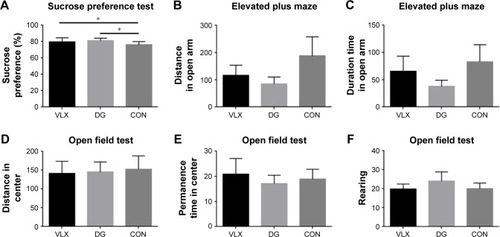
Figure 2 PCA is an unsupervised multidimensional statistical analysis method, which can explain the overall metabolic differences between groups and the variability within each group.
Abbreviations: CON, control; DG, diterpene ginkgolide; PCA, principal component analysis.
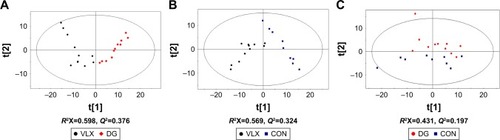
Figure 3 PLS-DA is a supervised analysis method. In the supervised PLS-DA, R2Y and Q2 are the two important parameters. Q2 >0.5 indicates that the model performs well in discriminant analysis.
Abbreviations: CON, control; DG, diterpene ginkgolide; PLS-DA, partial least squares-discriminant analysis; VLX, venlafaxine.
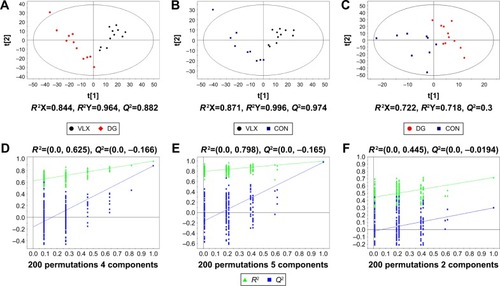
Table 1 Key differential metabolites in the DG and CON groups in the mouse prefrontal cortex
Figure 4 Heat map of the differential metabolites in the CON and DG groups.
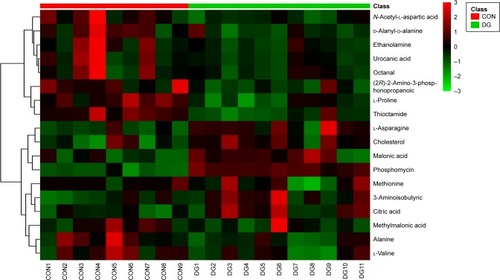
Figure 5 VLX and control groups.
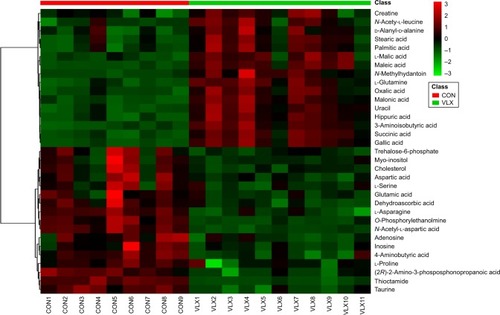
Figure 6 Red shows upregulation, green shows downregulation and yellow represents the opposite changes of the metabolites in the DG and VLX groups.
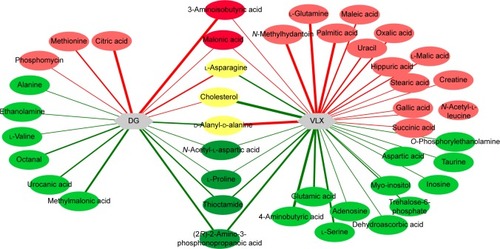
Figure 7 (A) The network involved 12 metabolites, including citric acid, cholesterol, 3-aminoisobutyric acid, methionine, asparagine, malonic acid, alanine, octanal, ethanolamine, N-acetyl-l-aspartic acid, methylmalonic acid and proline. Red indicates an increase in the metabolite, while blue indicates a decrease. Other metabolites are uncolored. (B) The relationship of metabolites in the network of venlafaxine.
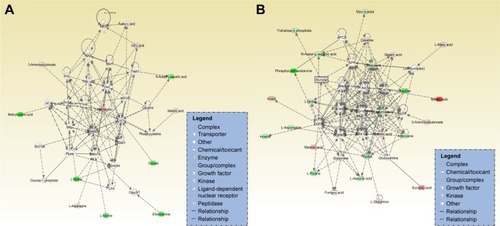
Figure 8 (A) Metabolite pathways in the DG group. (B) Metabolite pathways in the VLX group.
Abbreviations: DG, diterpene ginkgolide; TCA, tricarboxylic acid; VLX, venlafaxine.
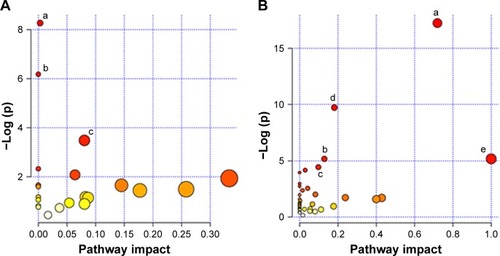
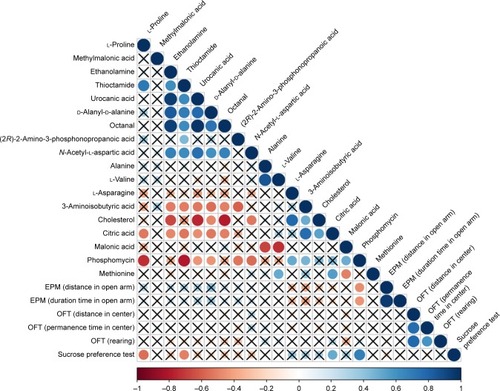
Figure 9 Differential metabolites were correlated with behavior.
Abbreviations: EPM, elevated plus maze; OFT, open field test.
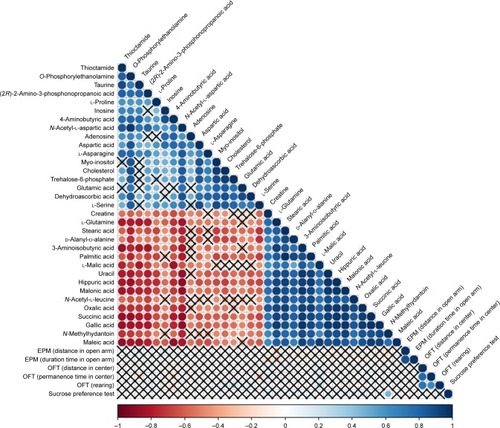
Figure 10 Correlation analysis of the DG group revealed a positive association of citric acid and phosphomycin in the sucrose preference test, a negative correlation of l-proline and thioctamide in the sucrose preference test and a negative association of phosphomycin in the EPM.