Figures & data
Figure 1 A flowchart of VMHC and the influenced connectivity patterns in CID patients. (A) The resting-state fMRI and T1-weighted data were preprocessed. (B and C) The time series of each voxel was extracted using a symmetrical hemisphere template in the MNI space. (D) Then, the VMHC was calculated. (E) The group mean of the VMHC was calculated to show the spatial distribution. (F) Group comparisons of the VMHC and (G) clinical associations in the CID patients were performed. (H) Finally, the network patterns (heterotopic connectivity) that were influenced by the altered VMHC in CID patients are shown.
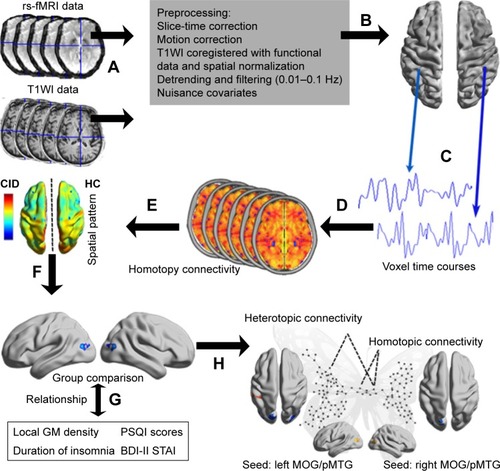
Table 1 Comparison of the demographic and neuropsychological data of the CID and HC groups
Figure 2 VMHC spatial patterns at the group mean level of the CID and HC groups. The warm color tone indicates higher homotopic connectivity coefficients.
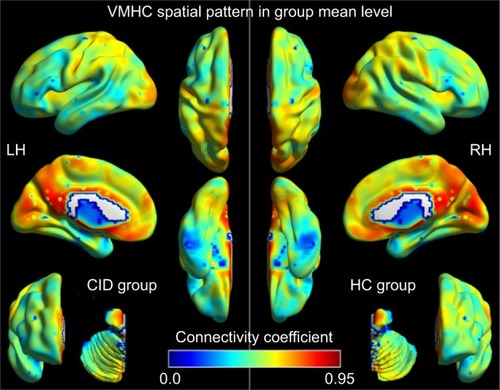
Figure 3 Altered VMHC in the CID group compared with the HC group.
Abbreviations: VMHC, voxel-mirrored homotopic connectivity; CID, chronic insomnia disorder; HC, healthy control; L, left; LH, left hemisphere; MOG, middle occipital gyri; pMTG, posterior middle temporal gyrus; R, right; RH, right hemisphere.
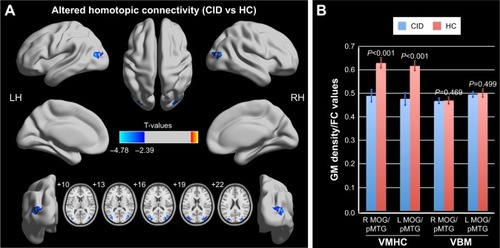
Table 2 Differences in homotopic connectivity and heterotopic connectivity bet ween the CID patient and control groups (P<0.01, GRF-corrected for multiple comparisons at a cluster level of P<0.05)
Figure 4 Significant group differences in the connectivity patterns (heterotopic connectivity) of the seed regions, with decreased VMHC being observed in the right MOG/pMTG (A) and the left MOG/pMTG (B) (P<0.01, GRF-corrected at a cluster level of P<0.05).
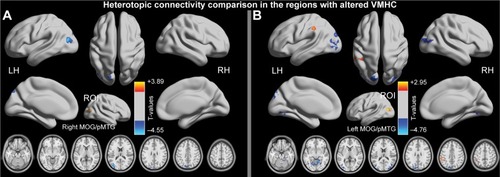
Figure 5 Significantly decreased VMHC values of the right or left MOG/pMTG in the ROC analysis, showing a moderate differentiating ability.
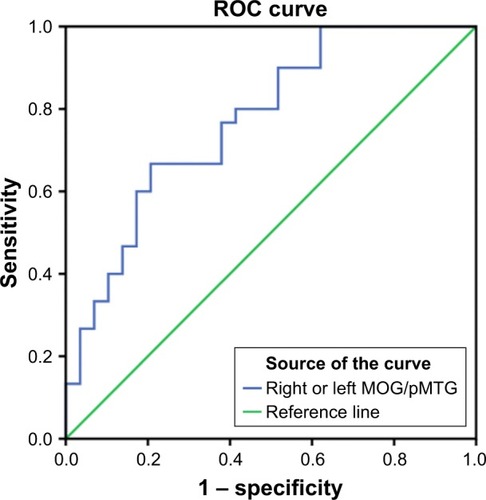
Figure 6 Correlations between the connectivity coefficients and the STAI-s and STAI-t scores in the CID patients.
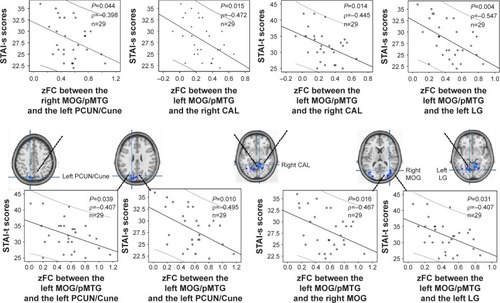
Table S1 ROC analysis for differentiating the patients from the healthy subjects
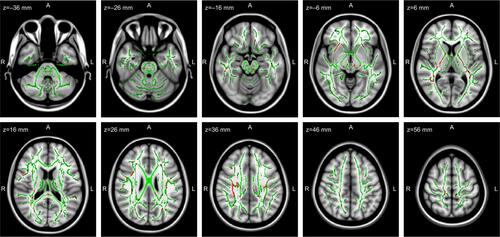
Figure S1 TBSS results of the FA images between the controls and CID patients. Green represents the mean FA skeleton of all participants; red represents the regions with decreased FA in the CID patients (P<0.05, without correction for multiple comparisons).
Abbreviations: TBSS, tract-based spatial statistics; CID, chronic insomnia disorder; FA, fractional anisotropy.