Figures & data
Table 1 Demographic and clinical parameters of the healthy control and patient groups
Figure 1 The ICA analysis results.
Abbreviations: FWE, family-wise error; ICA, independent component analysis; RSN, resting-state network.
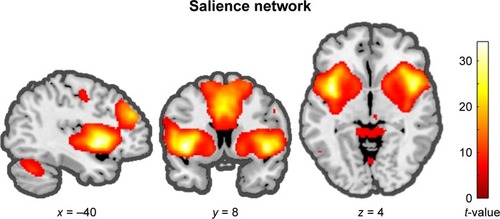
Figure 2 Group comparisons of SN FC (patients versus controls).
Abbreviations: FC, functional connectivity; SN, salience network; SC, schizophrenia; HC, healthy control.
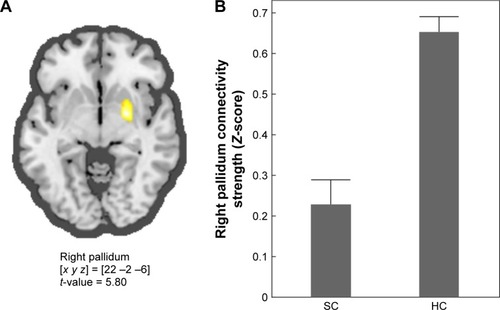
Table 2 Regions showing significant decreased salience network functional connectivity in patients with schizophrenia (n = 21) compared to controls (n = 21)
Table 3 Correlation coefficients between right pallidum FC, PANSS positive and negative scores, CDSS total scores, BACS composite scores, and SQLS psychosocial subscale scores in patients with schizophrenia (n = 21)
Figure 3 SEM results of the best model.
Abbreviations: CFI, comparative fit index; FC, functional connectivity; CDSS, Calgary Depression Scale for Schizophrenia; RMSEA, root mean square error of approximation; PS, psychosocial; SEM, structural equation modeling; SN, salience network; SQLS, schizophrenia Quality of Life Scale; SRMR, standardized root mean square residuals.
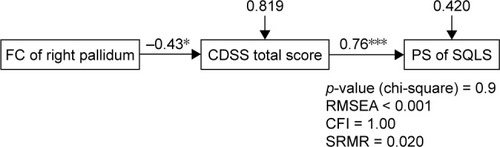
Table 4 Fit measures for the structural equation models
Figure S1 Model specification.
Note: Based on previous studies,Citation1–Citation6 we developed the hypotheses and made eight models for the purpose of SEM.
Abbreviations: QOL, quality of life; SN, salience network; SEM, structural equation modeling.
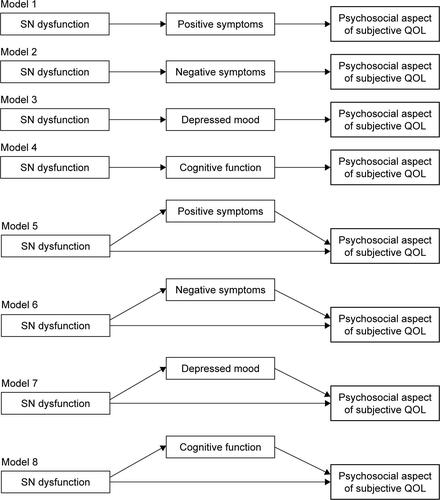
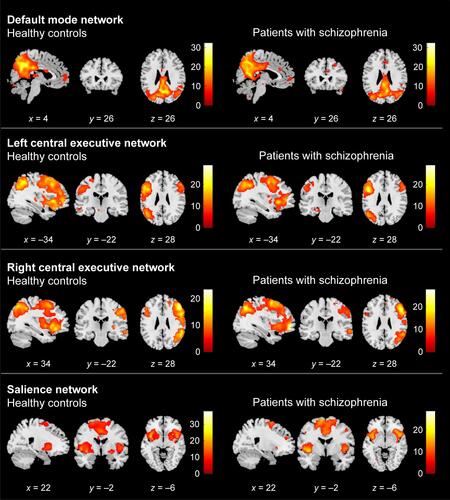
Figure S2 Comparison of connectivity maps for patients and controls across three RSNs (DMN, CEN, and SN).
Notes: Spatial maps are shown based on t-statistics with significance defined as FWE-corrected p < 0.05. Each RSN map was highly correlated with the RSN template (DMN, CEN, and SN),Citation7 respectively. The groups had similar DMN and CEN expressions. We could not find any significant group differences in DMN nor CEN.
Abbreviations: CEN, central executive network; DMN, default mode network; RSN, resting-state network; SN, salience network; FWE, family-wise error.