Figures & data
Table 1 Animal models
Table 2 Primers for qRT-PCR analysis
Figure 1 DA concentrations in the VTA of rats treated with saline (Ctrl), 20% ethanol (E), 30 mg/kg ketamine (K30), 60 mg/kg ketamine (K60), 30 mg/kg ketamine with 20% ethanol (K30+E), and 60 mg/kg ketamine with 20% ethanol (K60+E).
Abbreviations: SEM, standard error of the mean; VTA, ventral tegmental area; DA, dopamine.
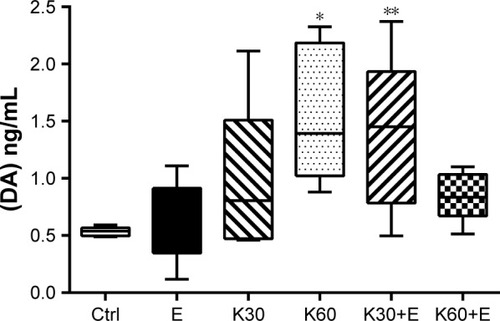
Figure 2 The gene expression levels of TH, DDC, VMAT2, and SNAP25 in the rat’s VTA of three independent brain samples in groups of the saline (Ctrl), 20% ethanol (E), 30 mg/kg ketamine (K30), 60 mg/kg ketamine (K60), 30 mg/kg ketamine with 20% ethanol (K30+E), and 60 mg/kg ketamine with 20% ethanol (K60+E) with three technical replicates of each sample.
Abbreviations: DDC, dopa decarboxylase; SEM, standard error of the mean; SNAP25, synaptosomal-associated protein 25; TH, tyrosine hydroxylase; VMAT2, vesicular monoamine transporter 2; VTA, ventral tegmental area.
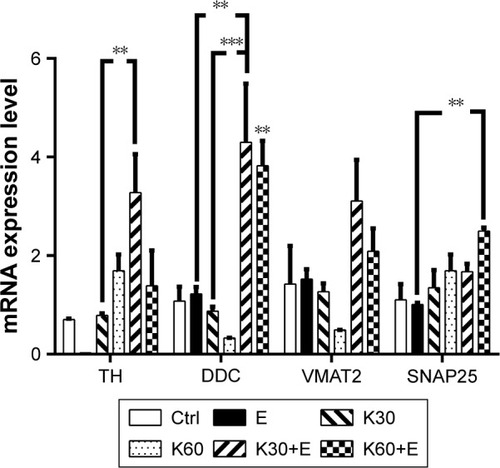
Figure 3 BDNF protein expression in the rat’s VTA treated with the saline (Ctrl), 20% ethanol (E), 30 mg/kg ketamine (K30), 60 mg/kg ketamine (K60), 30 mg/kg ketamine with 20% ethanol (K30+E), and 60 mg/kg ketamine with 20% ethanol (K60+E).
Abbreviations: BDNF, brain-derived neurotrophic factor; SEM, standard error of the mean; VTA, ventral tegmental area.
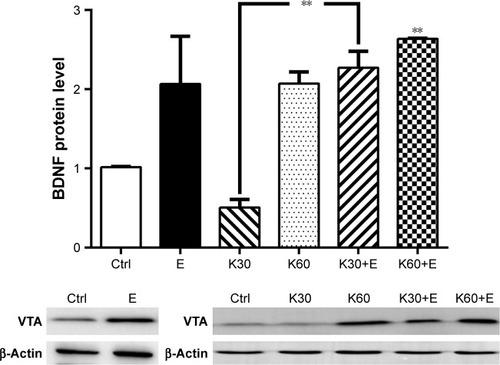
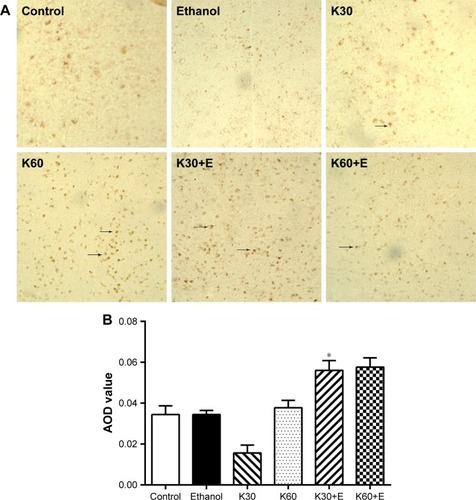
Figure 4 (A) TH immunostaining of section from the rat’s VTA treated with the saline (Control), 20% ethanol (Ethanol), 30 mg/kg ketamine (K30), 60 mg/kg ketamine (K60), 30 mg/kg ketamine with 20% ethanol (K30+E), and 60 mg/kg ketamine with 20% ethanol (K60+E), N = 3 per group, TH positive neurons (brown, arrows) were found in the VTA as shown, 200×. (B) AOD of immunohistochemical staining of TH calculated by Image Pro Plus 6.0 software. *Indicates p<0.05 compared to the saline control.