
Figures & data
Table 1 Sociodemographic characteristics of OCD patients (N=293)
Figure 1 Flow diagram of the study progress.
Abbreviation: Y-BOCS, Yale–Brown Obsessive Compulsive Scale.
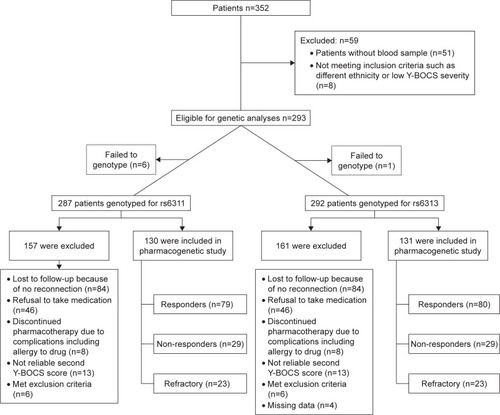
Table 2 Genotype distribution of the HTR2A polymorphisms in OCD patients and controls under different genetic models considering sex
Table 3 Genotype distribution of the HTR2A polymorphisms in familial form of OCD under different genetic models considering sex
Table 4 Haplotype association analysis of HTR2A polymorphisms rs6311 and rs6313 with OCD
Table 5 Genetic association analyses of the HTR2A polymorphisms with OCD treatment response under different genetic models considering sex
Table 6 Haplotype association analysis of HTR2A polymorphisms rs6311 and rs6313 with OCD treatment response