Figures & data
Table 1 Components and regions of interests defined by the spatial ICA analysis
Figure 1 The distribution diagram of regions of interesting which stand for eight resting-state networks.
Note: Above diagram shows the lateral brain from both sides respectively.
Abbreviations: L, left; R, right; PCC, posterior cingulate gyrus; MPFC, medial prefrontal gyrus; SFG, superior frontal gyrus; SPL, superior parietal lobule; IFG, inferior frontal gyrus; IPL, inferior parietal lobule; STG, superior temporal gyrus; PCG, precentral gyrus; MTG, middle temporal gyrus.
Abbreviations: L, left; R, right; PCC, posterior cingulate gyrus; MPFC, medial prefrontal gyrus; SFG, superior frontal gyrus; SPL, superior parietal lobule; IFG, inferior frontal gyrus; IPL, inferior parietal lobule; STG, superior temporal gyrus; PCG, precentral gyrus; MTG, middle temporal gyrus.
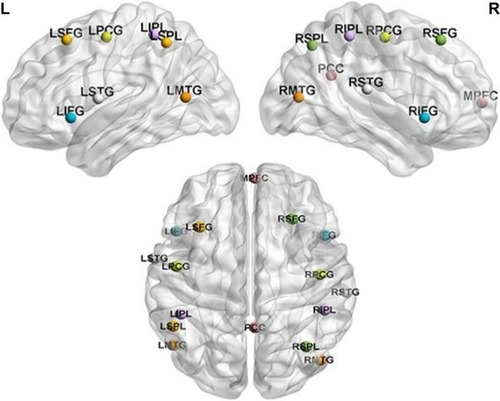
Table 2 The PPI results of the patient group for each network
Figure 2 The modulatory effectives of those eight RSNs after cluster-level false discovery rate corrected.
Note: Only the default mode network showed negative results which indicate left angular gyrus and medial frontal gyrus restrain MPFC and PCC work together.
Abbreviations: PCC, posterior cingulate gyrus; MPFC, medial prefrontal gyrus; R, right; L, left; AN, auditory network; DAN, dorsal attention network; MN, motor network; LEN, left executive network; REN, right executive network; SN, salience network; EN, extrastriate network.
Abbreviations: PCC, posterior cingulate gyrus; MPFC, medial prefrontal gyrus; R, right; L, left; AN, auditory network; DAN, dorsal attention network; MN, motor network; LEN, left executive network; REN, right executive network; SN, salience network; EN, extrastriate network.
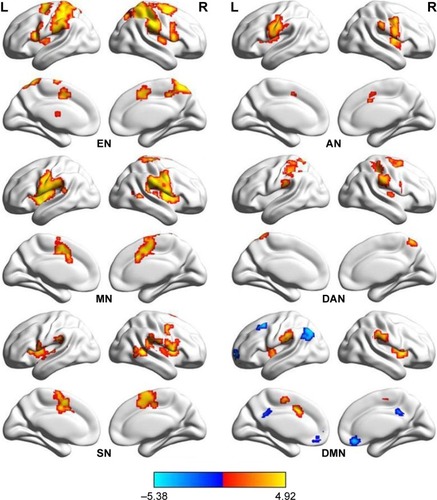
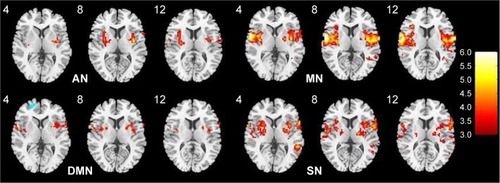
Figure 3 The positive modulatory effects are showed in warm color, and this diagram exhibits the insular gyrus effect of AN, MN, DMN, SN in a transverse view.
Notes: The maps were thresholded at P<0.05 FDR corrected with a height threshold of P<0.001. The values above the brain atlas represent the z coordinate of MNI space.
Abbreviations: MNI, Montreal Neurological Institute; FDN, false discovery rate; AN, auditory network; MN, motor network; DMN, default mode network; SN, salience network.
Abbreviations: MNI, Montreal Neurological Institute; FDN, false discovery rate; AN, auditory network; MN, motor network; DMN, default mode network; SN, salience network.