
Figures & data
Table 1 Brief description of Woodcock–Johnson III tests and constructs measured
Figure 1 Example of a clinician-delivered working memory training procedure.
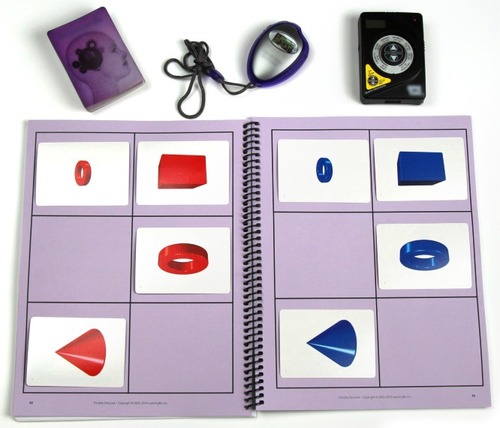
Figure 2 Comparison of treatment and control groups on median pretest to posttest change in test scores.
Abbreviation: GIA, General Intellectual Ability.
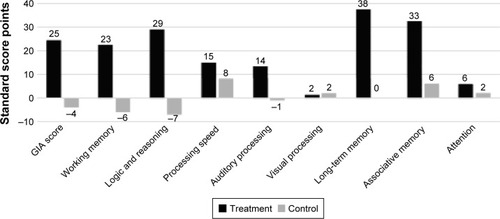
Table 2 Descriptive statistics for pretest to posttest change scores and overall difference between groups
Table 3 Statistical comparisons between treatment and control groups for each construct measured
Table 4 Cut score thresholds and clinically significant change in Woodcock–Johnson W scores
Table 5 Magnitude of change by case and construct measured