
Figures & data
Figure 1 Search strategy used for the inclusion of the studies considered in the meta-analysis.

Table 1 Demographic and clinical characteristics of the task-based fMRI studies included in the current meta-analysis
Figure 2 Regions of decreased (blue) activation in individuals with anxiety disorder compared with HC during cognitive reappraisal and subgroup analysis of medication naive group, 3 T MRI group, AFNI software group, SAD group and GAD and SAD group.
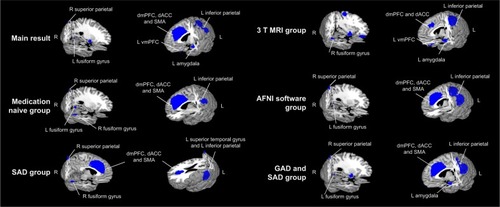
Table 2 Altered regional differences in activation during cognitive reappraisal in patients with anxiety disorder compared to healthy controls
Table 3 Subgroup analyses of the included studies
Figure 3 Results of the meta-regression analysis showing the percentage of female patients with a positive relationship with activation in the right fusiform gyrus. In the graphs, AES-SDM values needed to create this plot were extracted from the peak of maximum slope significance, and each study is represented as a dot, whose size reflects sample size. The regression line (meta-regression signed differential mapping slope) is shown.
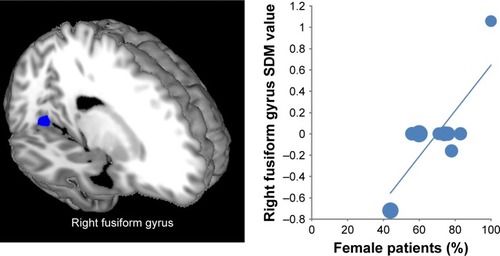
Table S1 Imaging methodology quality assessment checklist (when criteria were partially met, 0.5 points were assigned)
Table S2 Sensitivity analyses of task-based fMRI studies of regional differences in activation in patients with anxiety disorder compared with healthy controls