Figures & data
Table 1 Ptaarticipants’ distribution according to age group, gender, and educational level
Table 2 Participants’ distribution according to scores regarding the ability to draw inferences from non-factive mental verbs with the social aspect
Table 3 Participants’ distribution according to scores regarding the ability to draw inferences from cognitive factive mental verbs
Table 4 Mean performance of the sample (N=94) on the subtasks of the SMVUT
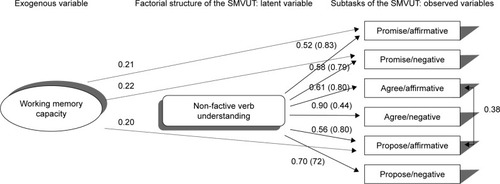
Figure 1 MIMIC model examining the impact of working memory capacity on the underlying structure of the SMVUT standardized solution.
Notes: All paths drawn indicate significant associations (P<0.05). Errors are shown in parentheses.
Abbreviations: MIMIC, Multiple Indicators Multiple Causes; SMVUT, Social Mental Verb Understanding Task.
Abbreviations: MIMIC, Multiple Indicators Multiple Causes; SMVUT, Social Mental Verb Understanding Task.