
Figures & data
Figure 1 Flowchart showing the patient enrolment process.
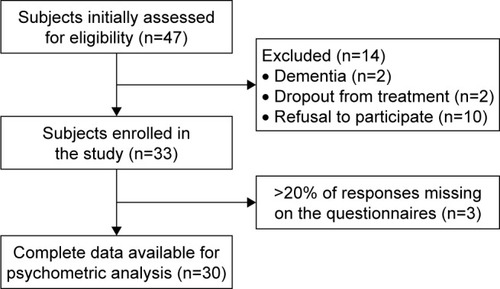
Table 1 Sociodemographic and clinical characteristics of the total sample (n=30)
Table 2 Changes in mean scores of psychological factors and cognitive–metacognitive scales at admission to discharge from the rehabilitation program (total patients=30)
Figure 2 PAM and NAM at admission (t0) and discharge (t1), with changes between the two evaluations.
Abbreviations: NAM, negative alcohol metacognitions; PAM, positive alcohol metacognitions.
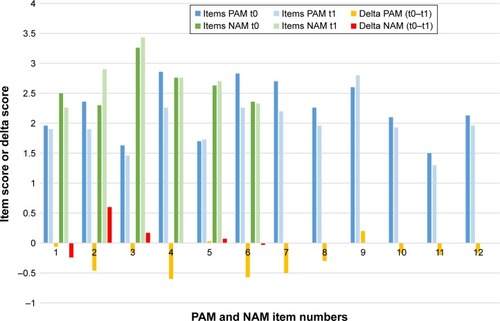
Figure 3 B-RRS and PACS at admission (t0) and discharge (t1), with changes between the two evaluations.
Abbreviations: B-RRS, Brooding subscale of Ruminative Response Scale; PACS, Penn Alcohol Craving Scale.
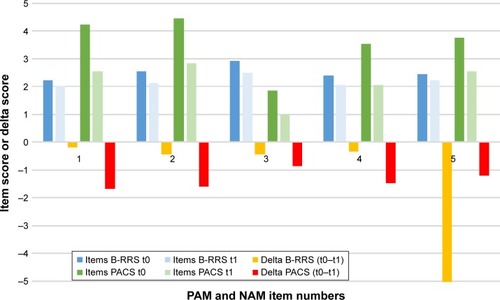
Table 3 Results on the four self-report questionnaires (PAMS, NAMS, B-RRS, and PACS) at admission and discharge: a comparison of patients subdivided by sex, work status, treatment intervention, and previous admissions
Table 4 Correlations among post-treatment CBA-OE subscales and pretreatment cognitive and metacognitive factors
Table 5 Multivariate regression model for predictors of post-treatment psychological variables