
Figures & data
Figure 1 Haplotype block structure for CRHBP and CRHR1.
Note: The numbers in the squares refer to pairwise linkage disequilibrium (LD) measured as D, with darker colors depicting stronger LD.
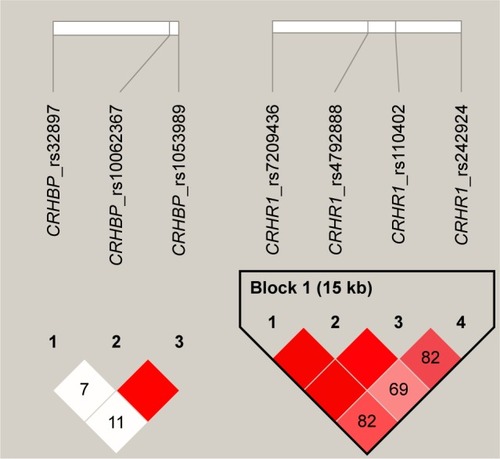
Table 1 Demographic and clinical characteristics of study participants (n=128) showing differences between those with/without childhood trauma exposure
Table 2 Differences in mean global NCI scores (z-scores) by ART status
Table 3 Differences in neurocognitive impairment (z-scores) across genotypes for CRHBP rs10062367
Table 4 Predictive value of CRHR1 variants × childhood trauma interactions on cognitive domain scores