
Figures & data
Figure 1 Metabolomic analysis of PFC samples from CON, rtPA, rtPA+DG, and rtPA+GBE rats. (A) PLS-DA score plot for the comparison of CON, rtPA, rtPA+DG, and rtPA+GBE rats, (B) PLS-DA score plots for pairwise comparisons between CON and rtPA, (C) rtPA and rtPA+DG, or (D) rtPA and rtPA+GBE. (E) Statistical validation of the PLS-DA model by permutation testing of CON, rtPA, rtPA+DG, and rtPA+GBE rats, statistical validation of the PLS-DA model by permutation testing between (F) CON and rtPA, (G) rtPA and rtPA+DG, or (H) rtPA and rtPA+GBE. The criterion used for determination of validity was that all blue Q2 values to the left were lower than the original points to the right.
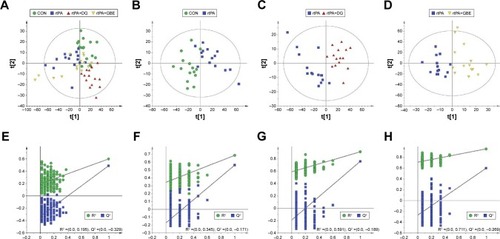
Figure 2 Heat map of the differential metabolites in the rat PFC for comparisons of rtPA vs CON, rtPA+DG vs rtPA, and rtPA+GBE vs rtPA.
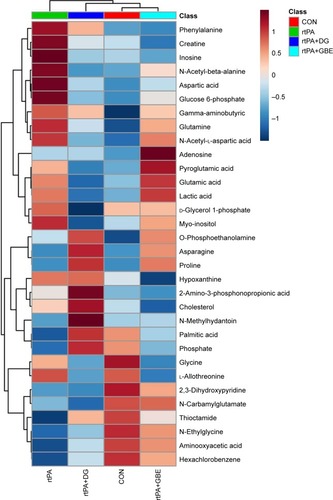
Figure 3 (A) Venn diagram of the differential metabolites in rat PFC for the comparisons of rtPA versus CON, rtPA+DG versus rtPA, and rtPA+GBE versus rtPA. (B) Correlation network between these differential metabolites and the three comparisons. The line colors represent the direction of the fold change in the differential metabolites. Red lines indicate that levels are upregulated in the comparison, whereas green boxes indicate the levels are downregulated. The line widths represent the VIP scores for the differential metabolites.
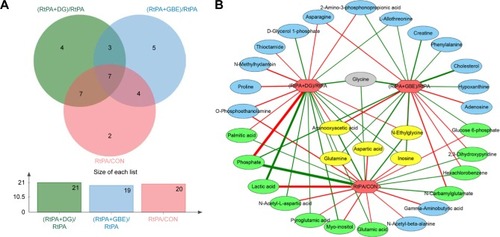
Table 1 Differential metabolites among the comparisons of rtPA/CON, rtPA+DG/rtPA, and rtPA+GBE/rtPA
Figure 4 PLS-DA score plots for pairwise comparisons between (A) CON and rtPA+DG or (B) CON and rtPA+GBE. Statistical validation of the PLS-DA model by permutation testing between (C) CON and rtPA+DG or (D) CON and rtPA+GBE. The criterion used for determination of validity was that all blue Q2 values to the left were lower than the original points to the right.
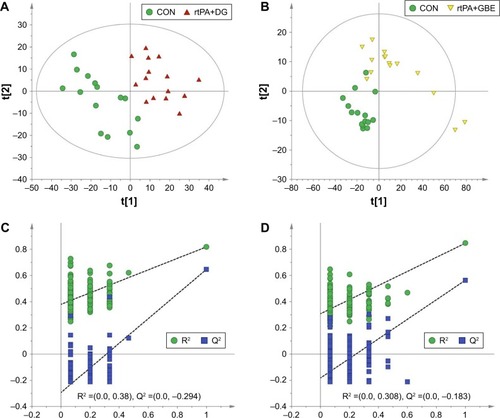
Figure 5 (A) Correlation network between these differential metabolites and the three comparisons of rtPA versus CON, rtPA+DG versus rtPA, and rtPA+DG versus CON. (B) Correlation network between these differential metabolites and the three comparisons of rtPA versus CON, rtPA+GBE versus rtPA, and rtPA+GBE versus CON.
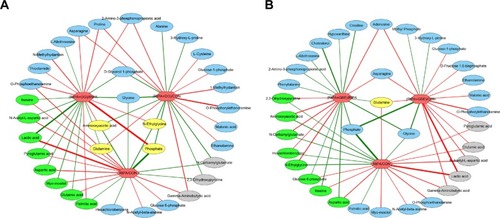
Figure 6 (A) Significant pathways of rtPA treatment-related differential metabolites. (B) Significant pathways of differential metabolites in the comparison set of rtPA+DG versus rtPA. (C) The relative intensity of the differential metabolites in the four groups. *P<0.05, **P<0.01, ***P<0.001.
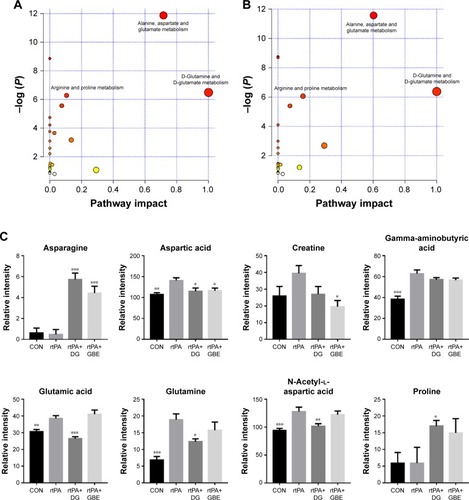
Figure 7 Simplified schematic diagram of the metabolic changes induced by administration of rtPA, DG, and GBE. Red boxes indicate upregulation in the comparison, yellow boxes indicate no change, and green boxes indicate downregulation.
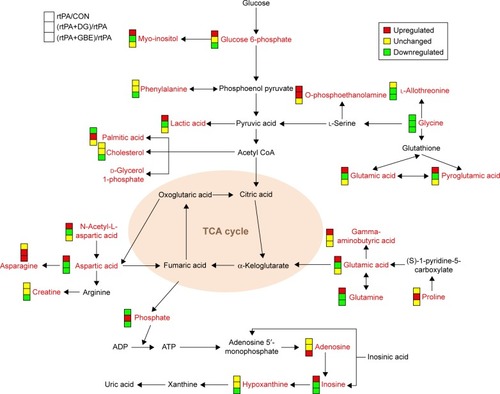
Figure 8 Network of “amino acid metabolism, cell-to-cell signaling and interaction, molecular transport” associated with key differential metabolites in the comparison of rtPA and CON groups in rats PFC with a score of 38 and 14 differential metabolites involved.
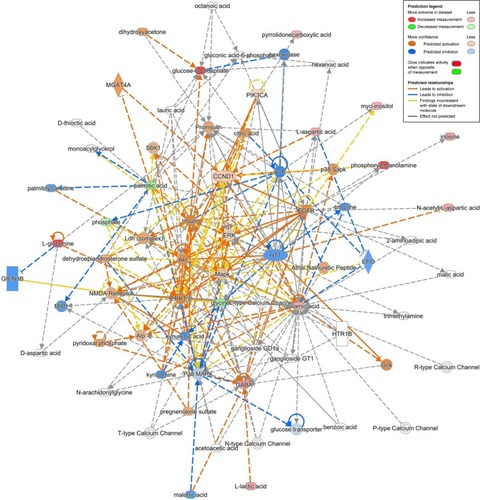
Figure 9 Network of “amino acid metabolism, cell-to-cell signaling and interaction, molecular transport” associated with key differential metabolites in the comparison of rtPA+GBE and CON groups in rats PFC with a score of 40 and 15 differential metabolites involved.
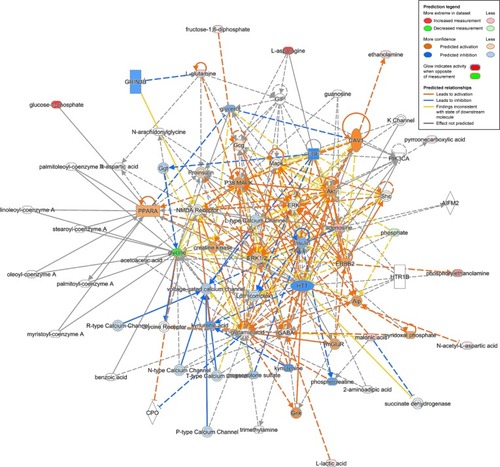
Figure 10 Network of “cellular compromise, lipid metabolism, small molecule biochemistry” associated with key differential metabolites in the comparison of rtPA+DG and CON groups in rats PFC with a score of 38 and 14 differential metabolites involved.
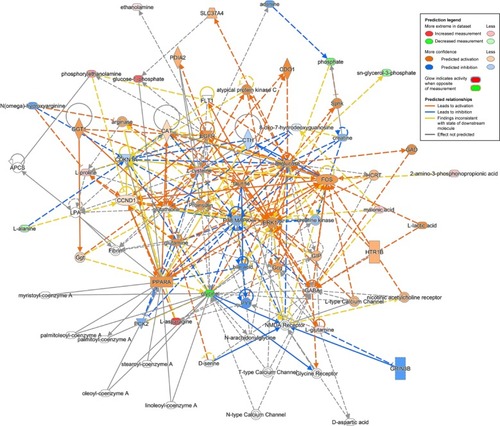
Figure S1 Principal component analysis (PCA) score plot of all samples. R2X =0.987, Q2 =0.859. The main parameters of PCA are the two principal components, including R2X and Q2. Generally, the main parameter for judging the quality of the model is R2X, which indicates how well the model explains the data. A value of 0.4 indicates that the model is reliable.
Abbreviations: rtPA, recombinant tissue plasminogen activator; DG, diterpene ginkgolide; GBE, Ginkgo biloba extract; QC, quality control; CON, control.
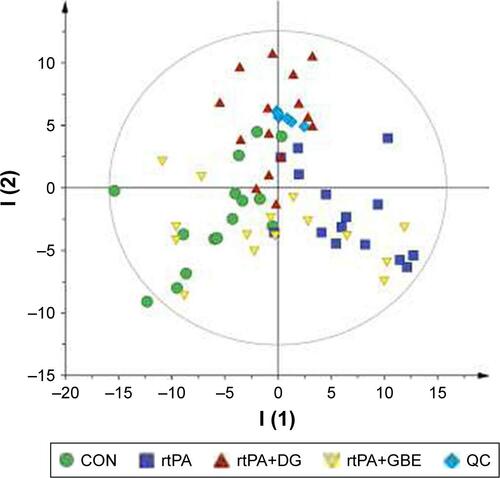
Table S1 Key differential metabolites in the comparison of rtPA+DG and CON groups in rat PFC
Table S2 Key differential metabolites in the comparison of rtPA+GBE and CON groups in rat PFC