Figures & data
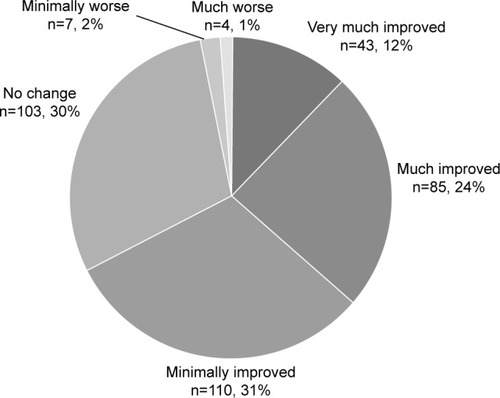
Figure 1 “Specimen sign” of a patient with oral cenesthopathy.
Notes: (A) “Sticky liquid’’ coming from the patient’s palate was collected in a bottle and brought to our clinic. (B) “White powder from the gum of the upper jaw’’ was brought to show on the black plastic case, after drying his saliva.
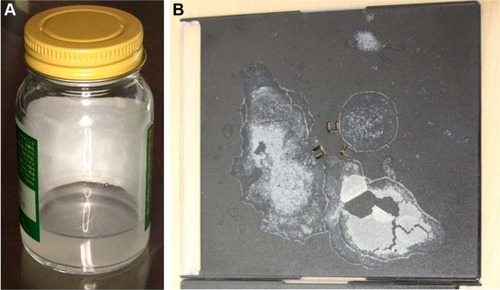
Figure 2 Distribution of male and female patients.
Notes: White and gray bars show the numbers of male and female patients, respectively. The numbers of patients in each age group are described beside the bars. The distributions are mono-modal with the peak in their 60s in both the patients.
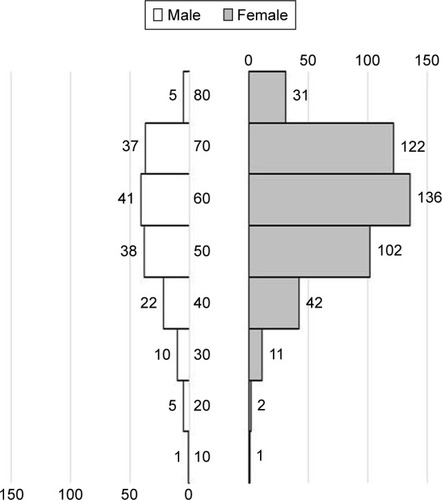
Table 1 Demographic and clinical characteristics of patients
Table 2 Details of the dental treatments that are considered to trigger the symptoms
Table 3 Differences between male and female patients
Figure 3 State of depression at the onset of oral cenesthopathy.
Notes: The number of patients with oral cenesthopathy after depression was 120 (77%). Eighteen patients developed depression after the onset of oral cenesthopathy. Simultaneous onset of oral cenesthopathy and depression was seen in 2%.
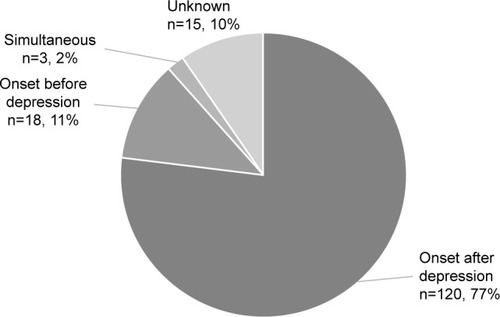
Table 4 Relationship between the trigger of oral cenesthopathy and phase of depression
Table 5 Results of logistic regression analysis of good treatment outcome
Figure 4 Course of oral cenesthopathy after 6 months of treatment using the clinical global impression improvement score.
Notes: A total of 352 patients were followed up over 6 months. Only 128 patients (36%) had a clinically significant improvement.