Figures & data
Table 1 Demographic and clinical characteristics of PD patients and healthy controls
Figure 1 Brain regions with significant metabolic abnormalities in PD patients relative to normal subjects detected by two-sample t-test analysis of 18F-FDG PET scans with SPM in Chongqing and Shanghai cohorts, respectively. (A) Metabolism in PD patients from the Chongqing cohort was characterized by metabolic increases in the putamen, GP, thalamus, pons, sensorimotor cortex and cerebellum (red), along with metabolic decreases in parieto-occipital areas (blue). (B) Metabolism in PD patients from the Shanghai cohort was similarly characterized by metabolic increases in the putamen, GP, thalamus, pons, sensorimotor cortex and cerebellum (red), covarying with metabolic decreases in parieto-occipital areas (blue). The overlays are depicted in neurological orientation. Thresholds of the color bars represent Z values.
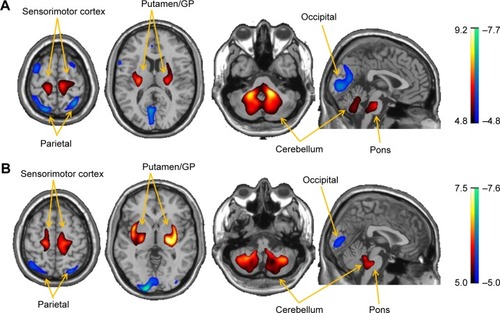
Figure 2 Brain regions with overlapping abnormal metabolism in PD patients relative to normal subjects detected by conjunction analysis of 18F-FDG PET scans with SPM across Chongqing and Shanghai cohorts. (A) Metabolism in PD patients was increased (red) in the putamen, GP, thalamus, pons, sensorimotor cortex and cerebellum, but decreased (blue) in parieto-occipital areas. The thresholds of the color bars represent T values. (B) Group differences in relative metabolic values in select cortical and subcortical regions, obtained post hoc in spherical volumes of interest (4 mm radius) centered at the peak of clusters deemed significant from prior SPM analysis on a voxel-by-voxel basis. Error bars represent mean±SD.
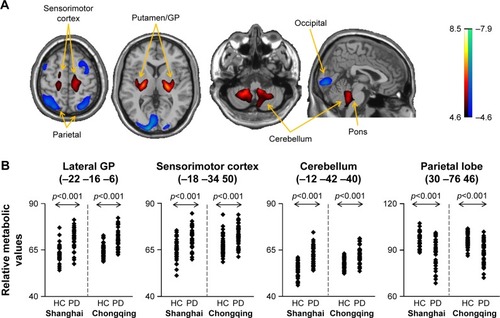
Table 2 Overlapping brain regions with significant metabolic differences between Shanghai and Chongqing patient cohorts relative to healthy controls
Figure 3 Brain regions with different abnormal metabolism in PD patients relative to normal subjects detected by interaction analysis of 18F-FDG PET scans with SPM across Chongqing and Shanghai cohorts. Metabolism in PD patients from the Shanghai cohort exhibited a greater increase (red) in the right temporal-striatal area, but a more significant decrease (blue) in the bilateral occipital region compared with imaging from the Chongqing cohort. The thresholds of the color bars represent T values.
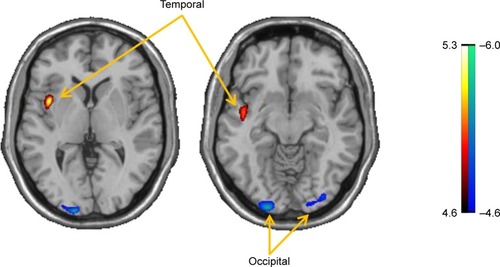
Table 3 Nonoverlapping brain regions with significant metabolic differences between Shanghai and Chongqing patient cohorts
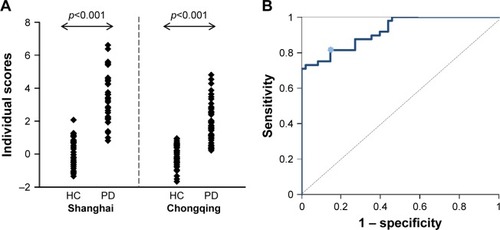
Figure 4 Diagnostic power for individual expression of PD-related cerebral metabolic activities derived by Shanghai cohort. (A) Individual scores were significantly increased in PD patients relative to normal subjects in both the derivation cohort from Shanghai (left, p<0.001) and the prospective validation cohort from Chongqing (right, p<0.001). The expression was slightly lower in PD patients from Chongqing compared to data from the Shanghai cohort, but no significant difference was observed between the two control groups. (B) The ROC curve for individual scores prospectively calculated in subjects from the Chongqing cohort could significantly discriminate patients from healthy controls, with a sensitivity of 81.3% and a specificity of 85.4% at an optimum cut-off value of 0.6467. The inflection point corresponding to the optimal cut-off value was represented by an asterisk on the ROC curve.