
Figures & data
Table 1 Demographic data of MDD and HC groups (VBM)
Table 2 Demographic data of MDD and HC groups (rs-fMRI)
Figure 1 Lower ALFF value in the MDD group: bilateral precuneus, posterior cingulate cortex, right middle cingulate cortex, right calcarine, left calcarine, right lingual gyrus, and left cuneus.
Abbreviations: ALFF, amplitude of low-frequency fluctuations; MDD, major depressive disorder.
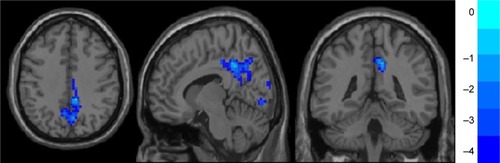
Figure 2 Lower fALFF value in the MDD group: bilateral precuneus and middle cingulate cortex.
Abbreviations: fALFF, functional amplitude of low-frequency fluctuations; MDD, major depressive disorder.
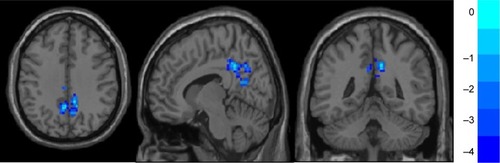
Figure 3 Lower ReHo value in the MDD group: bilateral precuneus, posterior cingulate cortex, and middle cingulate cortex.
Abbreviations: MDD, major depressive disorder; ReHo, regional homogeneity.
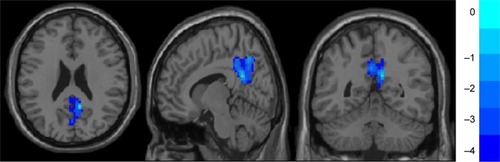
Table 3 Differentiated brain areas between the MDD and HC groups (rs-fMRI)
Table 4 Partial correlation of the HAM-D-17 and indexes of rs-fMRI