Figures & data
Figure 1 The present patient, a 29-year-old female.

Table 1 Summary of the patients with interstitial deletions in the 7q31 region
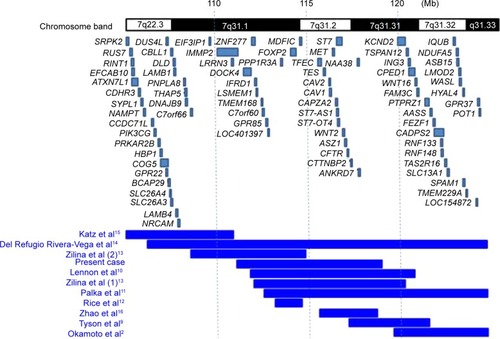
Figure 2 Genome map around 7q31 region depicting reported deletion regions.
Note: Deletion regions in previously reported patients and those in the present patient are depicted (blue bars). Genomic positions refer to build19.