Figures & data
Table 1 Primer sequence of target gene for rats
Figure 1 CUS caused depression-like behavior in rats.
Notes: (A) Experimental flowchart. (B) The sucrose preference and sucrose consumption were detected by SPT. (C) The immobility time in a beaker of water was detected by FST. (D) The total distance, time spent in center, and number of rearing behaviors were detected by OFT. The values are expressed as the mean ± SD. *P<0.05 vs normal group. #P>0.05 vs normal group.
Abbreviations: CUS, chronic unpredictable stress; SPT, sucrose preference test; OFT, open field test; FST, forced swimming test; CT, computed tomography; HE, hematoxylin and eosin; BMSCs, bone marrow mesenchymal stem cells.
Abbreviations: CUS, chronic unpredictable stress; SPT, sucrose preference test; OFT, open field test; FST, forced swimming test; CT, computed tomography; HE, hematoxylin and eosin; BMSCs, bone marrow mesenchymal stem cells.
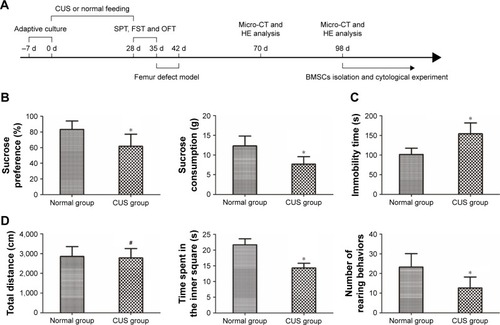
Figure 2 Depression attenuated bone healing in a rat femur defect model.
Notes: The bone defect healing was assessed by micro-CT analysis and histological observation at 4 and 8 weeks postsurgery. (A) 3D reconstruction images were used to evaluate the new bone formation within femur defect in rats. Red bar =200 μm. (B) Micro-CT parameters like BV/TV, Tb.N, Tb.Th, and Tb.Sp of the VOI were determined, respectively. (C) Histologic evaluation of HE stained paraffin-embedded tissue sections (amplification 200×). The values are expressed as the mean ± SD. *P<0.05 vs normal group.
Abbreviations: CUS, chronic unpredictable stress; CT, computed tomography; BV/TV, bone volume/trabecular volume ratio; Tb.N, trabecular number; Tb.Th, trabecular thickness; Tb.Sp, trabecular separation; VOI, volume of interest; HE, hematoxylin and eosin.
Abbreviations: CUS, chronic unpredictable stress; CT, computed tomography; BV/TV, bone volume/trabecular volume ratio; Tb.N, trabecular number; Tb.Th, trabecular thickness; Tb.Sp, trabecular separation; VOI, volume of interest; HE, hematoxylin and eosin.
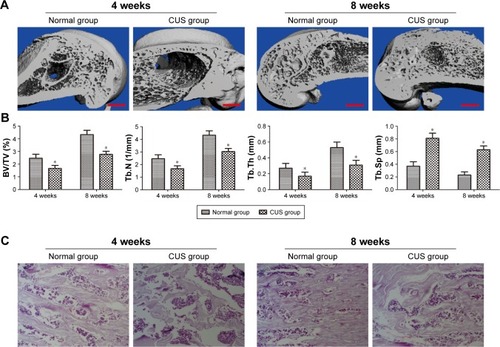
Figure 3 BMSCs derived from depressive rats had low osteogenic potential and autophagic level.
Notes: (A) Representative picture of ALP and ARS staining to detect osteogenic differentiation (amplification 200×). (B) The gene expressions of osteogenic markers COL I, OCN, OPN, and RUNX2 were examined by qPCR. Relative mRNA expressions were normalized to GAPDH. (C) Morphological observation of autophagy under TEM (amplification 15,000×). Red arrows represent the characteristic double-membranous ultrastructural morphology of autophagic vacuoles. N represents cell nucleus. (D) Western blot for the autophagy-related protein levels of LC3 and P62. The rate of LC3 II/I and P62/β-actin represent the relative expressions. The values are expressed as the mean ± SD. *P<0.05 vs normal group.
Abbreviations: ALP, alkaline phosphatase; ARS, Alizarin red S; CUS, chronic unpredictable stress; BMSCs, bone marrow mesenchymal stem cells; qPCR, quantitative polymerase chain reaction; TEM, transmission electron microscopy.
Abbreviations: ALP, alkaline phosphatase; ARS, Alizarin red S; CUS, chronic unpredictable stress; BMSCs, bone marrow mesenchymal stem cells; qPCR, quantitative polymerase chain reaction; TEM, transmission electron microscopy.
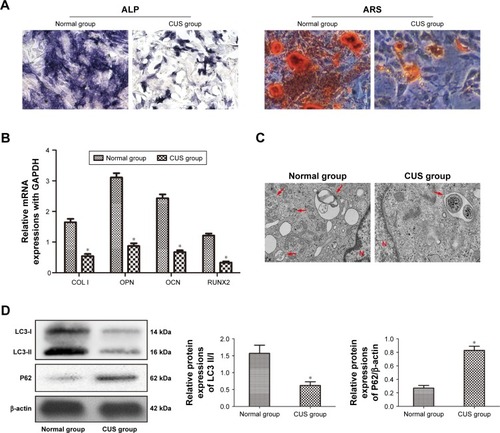
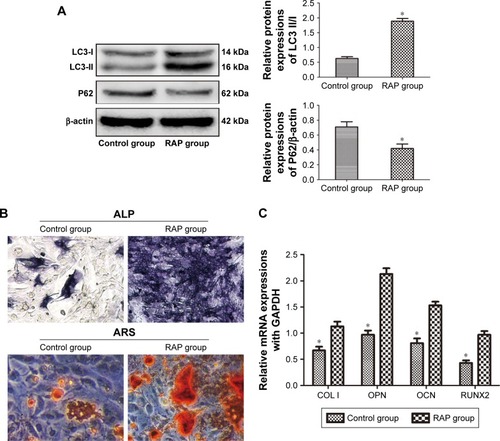
Figure 4 Autophagy activation promoted osteogenic differentiation of depressive BMSCs.
Notes: The depressive BMSCs were cultured in osteogenic differentiation medium in the presence of autophagy activator RAP. (A) Autophagic levels were detected by Western blot. (B) The levels of osteogenic differentiation were detected by ARS and ALP staining (amplification 200×). (C) The gene expressions of osteogenic marker COL I, OCN, OPN, and RUNX2 were examined by qPCR. Relative mRNA expressions were normalized to GAPDH. The values are expressed as the mean ± SD. *P<0.05 vs control group.
Abbreviations: RAP, rapamycin; ALP, alkaline phosphatase; ARS, Alizarin red S; BMSCs, bone marrow mesenchymal stem cells; qPCR, quantitative polymerase chain reaction.
Abbreviations: RAP, rapamycin; ALP, alkaline phosphatase; ARS, Alizarin red S; BMSCs, bone marrow mesenchymal stem cells; qPCR, quantitative polymerase chain reaction.