
Figures & data
Figure 1 Voxel-wise statistical non-parametric map (SnPM) of resting state sLORETA images in all patients (n=19) compared to healthy controls (n=15) at the 0.05 significance level after the correction for multiple comparisons. Yellow/red shades indicate increased delta sources (red for P<0.1; yellow for P<0.05). Structural anatomy is shown in gray scale (A – anterior; P – posterior; L – left; R – right).
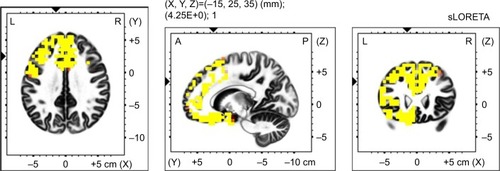
Table 1 Number and localization of increased delta sources in all patients in resting state compared with healthy controls (P≤0.05)
Figure 2 Voxel-wise statistical non-parametric map (SnPM) of sLORETA images in all patients (n=19) during imagery of an general anxiety scenario minus resting state acitivity compared to a general anxiety scenario minus the resting state acitivity in controls (n=15) at the 0.05 significance level after correction for multiple comparisons. Yellow/red shades indicate increased delta sources (red for P<0.1; yellow for P<0.05). Structural anatomy is shown in gray scale (A – anterior; P – posterior; L – left; R – right).
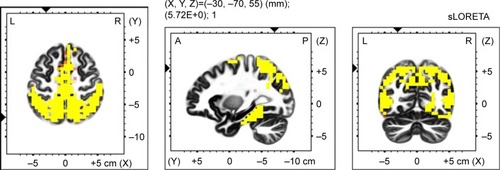
Table 2 Number and localization of increased delta sources in all patients during general anxiety scenario compared with healthy controls (P≤0.05)
Figure 3 Voxel-wise statistical non-parametric map (SnPM) of sLORETA images in all patients (n=19) during imagery of an general anxiety scenario minus resting state acitivity compared to a general anxiety scenario minus the resting state acitivity in controls (n=15) at the 0.05 significance level after correction for multiple comparisons. Yellow/red shades indicate increased theta sources (red for P<0.1; yellow for P<0.05). Structural anatomy is shown in gray scale (A – anterior; P – posterior; L – left; R – right).
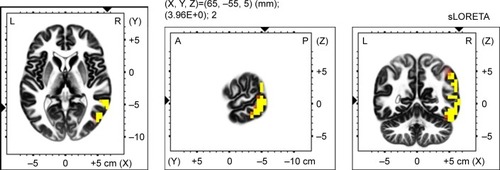
Table 3 Number and localization of increased theta sources in all patients during general anxiety scenario compared with healthy controls (P≤0.05)
Figure 4 Voxel-wise statistical non-parametric map (SnPM) of sLORETA images in all patients (n=19) during imagery of an general anxiety scenario minus resting state acitivity compared to a general anxiety scenario minus the resting state acitivity in controls (n=15) at the 0.05 significance level after correction for multiple comparisons. Yellow/red shades indicate increased alfa-1 sources (red for P<0.1; yellow for P<0.05). Structural anatomy is shown in gray scale (A – anterior; P – posterior; L – left; R – right).
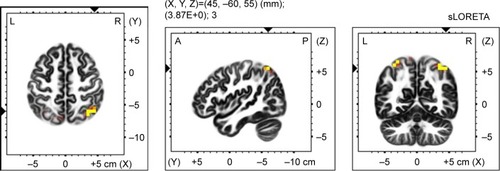
Table 4 Number and localization of increased alpha-1 sources in all patients during general anxiety scenario compared with healthy controls (P≤0.05)
Figure 5 Voxel-wise statistical non-parametric map (SnPM) of sLORETA images in all patients (n=19) during imagery of an general anxiety scenario compare to resting state at the 0.05 significance level after correction for multiple comparisons. Yellow/red shades indicate increased beta-3 sources (red for P<0.1; yellow for P<0.05). Structural anatomy is shown in gray scale (A – anterior; P – posterior; L – left; R – right).
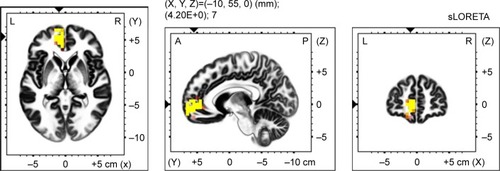
Table 5 Number and localization of increased beta-3 sources in all patients during general anxiety scenario compared with resting state in OCD patients (P≤0.05)