
Figures & data
Figure 1 Flow diagram.
Abbreviations: GP, general practitioner; mITT, modified intention-to-treat; D42, day 42; PP, per protocol.
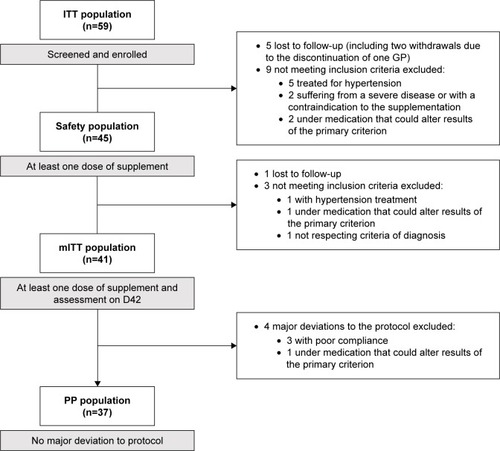
Table 1 Patient characteristics
Figure 2 Patients’ distribution into HRSD classes at day 0 (D0) and D42 (% [n], modified intention-to-treat population).
Abbreviation: HRSD, Hamilton Rating Scale for Depression.
![Figure 2 Patients’ distribution into HRSD classes at day 0 (D0) and D42 (% [n], modified intention-to-treat population).](/cms/asset/43403f6c-b93e-45d5-bf96-255223b82640/dndt_a_169575_f0002_b.jpg)
Figure 3 Evolution of HADS anxiety (A) and HADS depression (B) scores between day 0 (D0; n=40, mITT population) and D42 (n=39).
Notes: Data shown as mean ± SEM. *P<0.05, ***P<0.0001 versus D0.
Abbreviations: HADS, Hospital Anxiety and Depression Scale; mITT, modified intention-to-treat.
Abbreviations: HADS, Hospital Anxiety and Depression Scale; mITT, modified intention-to-treat.
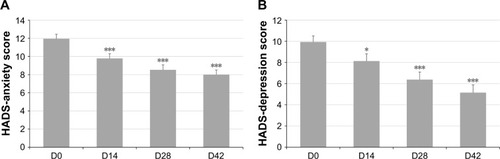
Figure 4 Evolution of patients’ distribution into HADS classes between day 0 (D0) and D42 (% [n]; modified intention-to-treat population).
Abbreviation: HADS, Hospital Anxiety and Depression Scale.
![Figure 4 Evolution of patients’ distribution into HADS classes between day 0 (D0) and D42 (% [n]; modified intention-to-treat population).](/cms/asset/529ff48d-6fd1-464c-b41a-36ca6af6ee06/dndt_a_169575_f0004_b.jpg)
Table 2 CGI and PGIC scores in the mITT population