Figures & data
Table 1 Demographics, clinical features, and DTI indices
Figure 1 TBSS analysis of FA and RD volumes revealed lower FA values (in red-yellow) and higher RD values (in yellow) in anxious MDD group when compared with the nonanxious group.
Notes: Results are overlaid on axial slices from the MNI standard brain at a permutation-based threshold of P<0.05 (FWE corrected). The background images are T1-weighted MNI template brains denoted with MNI coordinates. No regions of increased FA or decreased RD were found in the groups.
Abbreviations: FA, fractional anisotropy; FWE, family-wise error; MDD, major depressive disorder; MNI, Montreal Neurological Institute; RD, radial diffusivity; TBSS, tract-based spatial statistics.
Abbreviations: FA, fractional anisotropy; FWE, family-wise error; MDD, major depressive disorder; MNI, Montreal Neurological Institute; RD, radial diffusivity; TBSS, tract-based spatial statistics.
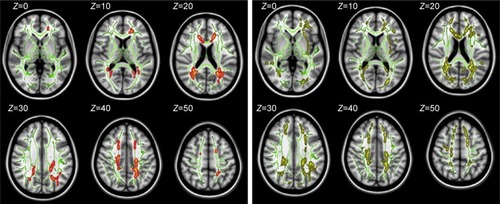
Table 2 Locations of significant (P<0.05, FWE corrected) group differences between anxious and nonanxious depressions in FA and RD
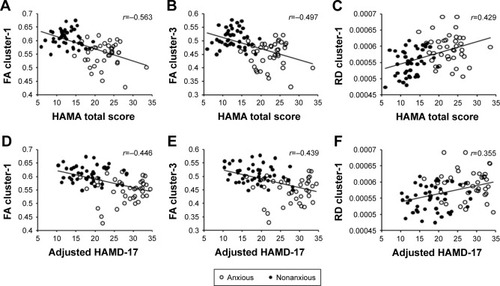
Figure 2 Correlation of FA and RD values with clinical features in pooled depression group.
Notes: (A) Mean FA values in cluster-1 and HAMA total scores (r=−0.563, P<0.001). (B) Mean FA values in cluster-3 and HAMA total scores (r=−0.497, P<0.001). (C) Mean RD values in cluster-1 and HAMA total scores (r=0.429, P<0.001). (D) Mean FA values in cluster-1 and adjusted HAMD-17 scores (r=−0.446, P<0.001). (E) Mean FA values in cluster-3 and adjusted HAMD-17 scores (r=−0.439, P<0.001). (F) Mean RD values in cluster-1 and adjusted HAMD-17 scores (r=0.355, P<0.001).
Abbreviations: FA, fractional anisotropy; HAMA, Hamilton Rating Scale for Anxiety; HAMD, Hamilton Rating Scale for Depression; RD, radial diffusivity.
Abbreviations: FA, fractional anisotropy; HAMA, Hamilton Rating Scale for Anxiety; HAMD, Hamilton Rating Scale for Depression; RD, radial diffusivity.