Figures & data
Table 1 Demographic and clinical characteristics
Table 2 Descriptive characteristics for RNFL parameters (baseline values and changes during follow-up) and their comparison between ON and FL eyes
Table 3 Results of the mixed-effects model using absolute differences between ON and FL eyes’ relative change to baseline
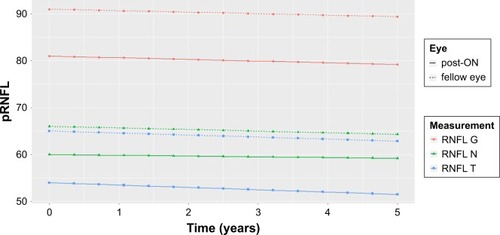
Figure 1 Mean linear trend for RNFL values.
Notes: The graph shows mean linear trends from baseline for the next 5 years. These trends were estimated using mixed-effects model. The intercept (value on y-axis) denotes mean thickness at the baseline for each parameter (RNFL G, RNFL N, RNFL T) and both (post-ON and fellow) eyes. The paired slopes for both eyes within one RNFL parameter tend to be similar.
Abbreviations: ON, optical neuritis; RNFL, retinal nerve fiber layer; RNFL G, mean peripapillary retinal nerve fiber layer thickness; RNFL N and RNFL T, retinal nerve fiber layer thickness for nasal and temporal segment, respectively.
Abbreviations: ON, optical neuritis; RNFL, retinal nerve fiber layer; RNFL G, mean peripapillary retinal nerve fiber layer thickness; RNFL N and RNFL T, retinal nerve fiber layer thickness for nasal and temporal segment, respectively.