Figures & data
Figure 1 Compressive SCI model.
Abbreviation: SCI, spinal cord injury.
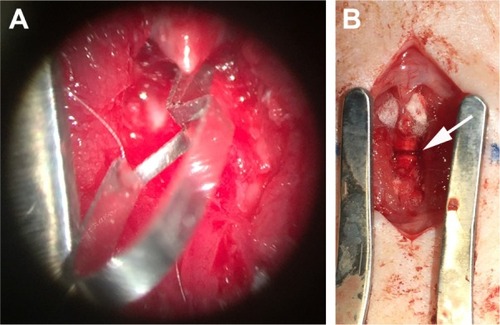
Figure 2 Line chart of the BBB scores of rats in the SCI and sham operation groups.
Abbreviations: SCI, spinal cord injury; BBB, Basso, Beattie, and Bresnahan Locomotor Rating Scale.
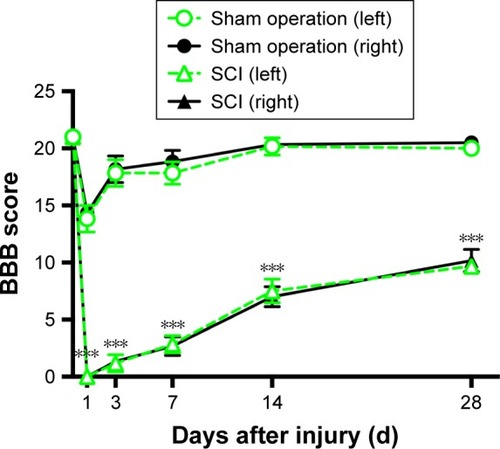
Figure 3 Myelination of the spinal cord after SCI investigated through staining of LFB.
Abbreviations: d, days; SCI, spinal cord injury; LFB, Luxol fast blue.
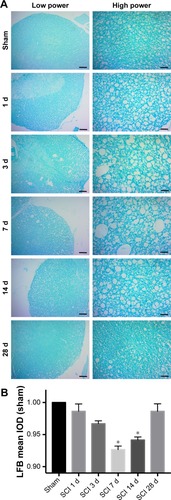
Figure 4 Immunohistochemistry of MBP in the SCI and sham operation groups.
Abbreviations: d, days; MBP, Myelin basic protein; SCI, spinal cord injury; IOD, integrated optical density.
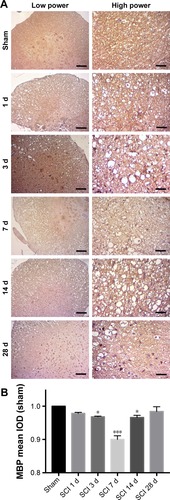
Figure 5 Immunohistochemistry of LPL in tissue from different time points after SCI and sham operation groups.
Abbreviations: d, days; LPL, rabbit anti-Plastin L; IOD, integrated optical density; SCI, spinal cord injury.
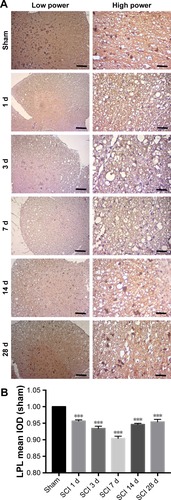
Figure 6 The protein expression of MBP was detected using Western blotting analyses.
Abbreviations: d, days; MBP, Myelin basic protein; SCI, spinal cord injury.
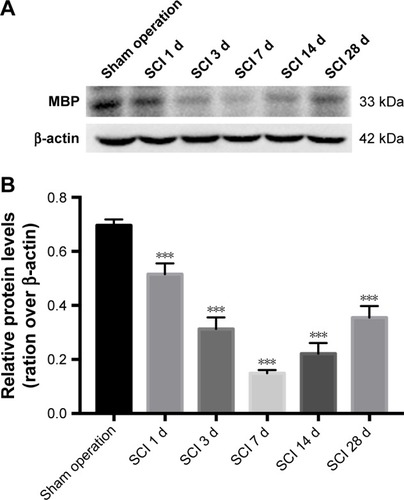
Figure 7 Double staining of ED-1 and MHC-II were used to investigate the microglial activation.
Abbreviations: d, days; DAPI, 4′,6-diamidino-2-phenylindole; SCI, spinal cord injury.
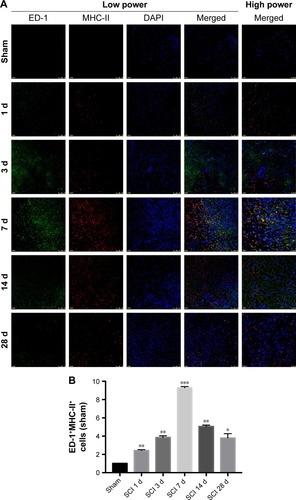
Figure 8 Bar graphs of iron, glutamate, ATP and potassium concentrations in the tissues around the injury site were compared in the different groups.
Abbreviations: d, days; SCI, spinal cord injury.
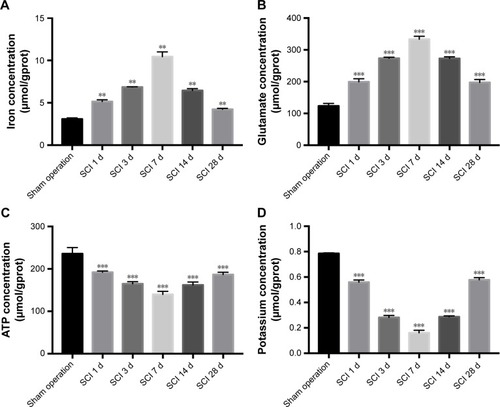
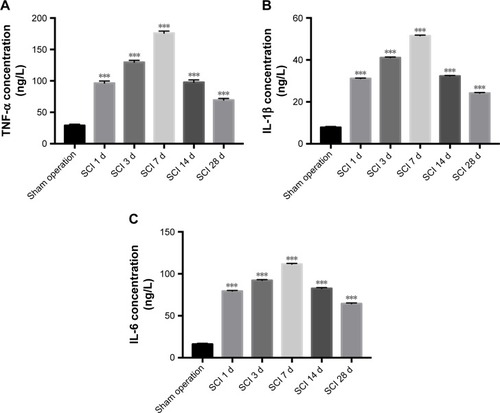
Figure 9 Bar graphs of the protein levels of pro-inflammatory cytokines, such as TNF-α, IL-1β, and IL-6, were compared in the SCI and sham operation groups.
Abbreviations: d, days; SCI, spinal cord injury.