Figures & data
Table 1 Demographic and clinical characteristics of control and TRD patient groups as well as responders and nonresponders subgroups
Figure 1 PE concentrations in sera from healthy controls and TRD patients. (A) PE concentrations in sera from healthy controls and TRD patients before (T0) or 1 day (T1) or 1 month (T2) after ECT. Statistical analysis was performed using Mann–Whitney U test between patients (TRD T0, n=45) and controls (n=49) and using Wilcoxon signed rank test between untreated (T0) and ECT-treated (T1 and T2) TRD. **P<0.01. (B) PE concentrations in sera from responders (R) and nonresponder (NR) TRD patients before (T0) and 1 month after ECT. **P<0.01.
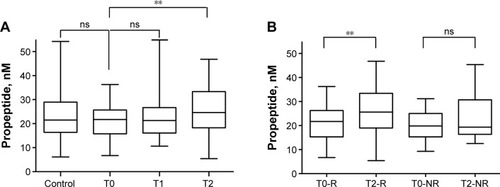
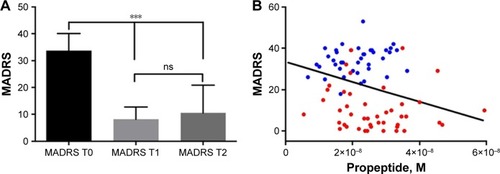
Figure 2 MADRS score evaluation of TRD patients. (A) Mean±SD of MADRS for TRD patients before (T0) or 1 day (T1) or 1 month (T2) after ECT. ***P<0.001. (B) A significant correlation was obtained between the concentration of PE (at T0 in blue and T2 in red) and their corresponding MADRS scores (r=−0.235, P=0.03).