
Figures & data
Table 1 Demographic characteristics of deployed personnel and scores of the TRS and other measures
Figure 1 Scree plot of the TRS.
Notes: EFA revealed only one factor with an eigenvalue (5.34) >1. This factor included 53.4% of the variance. This scree plot shows that one factor was suitable.
Abbreviations: EFA, exploratory factor analysis; TRS, The Tachikawa Resilience Scale.
Abbreviations: EFA, exploratory factor analysis; TRS, The Tachikawa Resilience Scale.
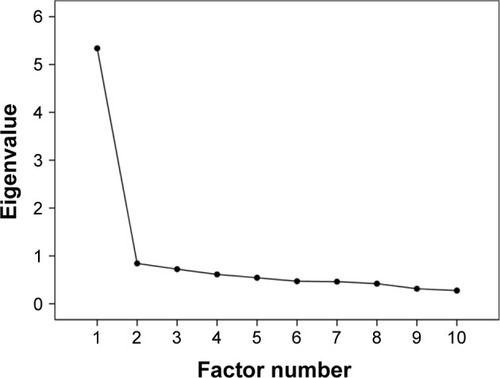
Table 2 Means, standard deviations, correlations with the TRS total score, Cronbach’s α if item was deleted, and factor loading of each item of the TRS
Table 3 Correlation between the TRS and the RCS-JS
Table 4 Results of hierarchical multivariate regression analysis