
Figures & data
Table 1 Baseline characteristics and clinical features of the patients
Table 2 Clinical outcomes of patients after intravenous thrombolysis
Figure 1 Scatter plot of PDW level in different clinical outcomes.
Abbreviations: PDW, platelet distribution width; mRS, modified Rankin Scale; ENI, early neurological improvement; sICH, symptomatic intracerebral hemorrhage; ECH, extracranial hemorrhage.
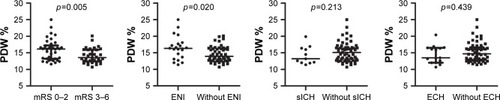
Figure 2 ROC curve of PDW in predicting a poor outcome of AIS patients.
Notes: AUC: 0.689 (95% CI 0.568–0.809); p=0.005.
Abbreviations: ROC, receiver operating characteristics; PDW, platelet distribution width; AUC, area under the curve; AIS, acute ischemic stroke.
Abbreviations: ROC, receiver operating characteristics; PDW, platelet distribution width; AUC, area under the curve; AIS, acute ischemic stroke.
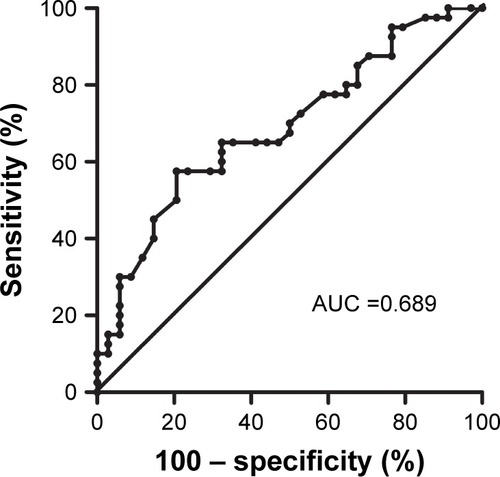
Table 3 Multivariable logistic regression analysis for PDW of outcome after stroke