Figures & data
Table 1 Coding of brain regions. To reduce the number of all brain regions occurring in the analyzed studies, they were summarized to 17 main regions
Table 2 Studies on structural connectivity using DTI
Table 3 Studies on functional connectivity with fMRi in resting state
Table 4 Studies on functional connectivity in task-related fMRI
Table 5 Studies on functional connectivity with EEG, MEG and SPECT
Table 6 Studies on effective connectivity
Figure 1 Functional connectivity (FC) for MDD patients compared with healthy controls for resting state (left) and task-related fMRI studies (right).
Notes: A/F: sagittal, lateral view; b/g: sagittal, anterior view; C/H: lateral view of the surface; D/I: sagittal, dorsal view; E/J: lateral view, insula displayed by removing the opercular brain segments. The orange lines represent increased, the blue lines decreased FC. The circles indicate an altered self-referential connectivity (ie, within the region). Colors of the brain regions are coded according to .
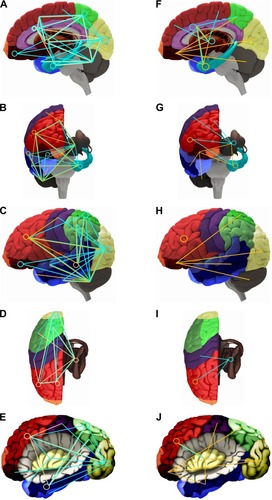
Figure 2 Synopsis of findings on FC in MDD compared to healthy controls using fMRI/resting state.
Abbreviations: FC, functional connectivity; fMRI, functional magnetic resonance imaging; MDD, major depressive disorder.
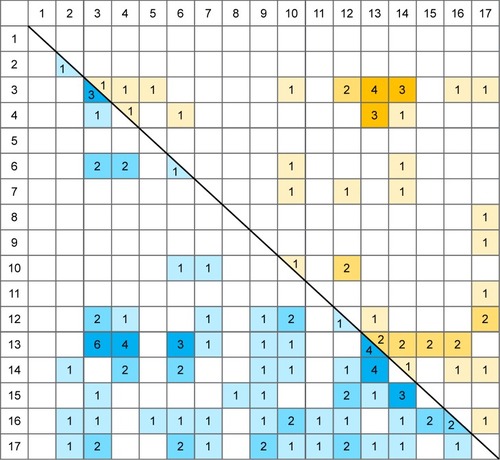
Figure 3 Histogram of the 17 regions found in fMRI/resting state studies showing the number of studies that found a region to have an altered FC with another region.
Abbreviations: FC, functional connectivity; fMRI, functional magnetic resonance imaging; MDD, major depressive disorder.
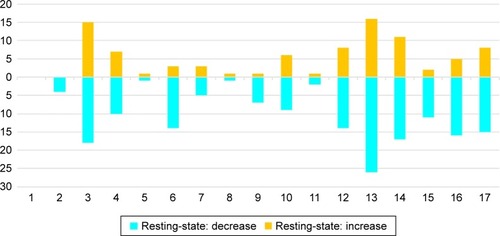
Figure 4 Synopsis of findings on functional connectivity in MDD compared to healthy controls using task-related fMRI.
Abbreviations: FC, functional connectivity; fMRI, functional magnetic resonance imaging; MDD, major depressive disorder.
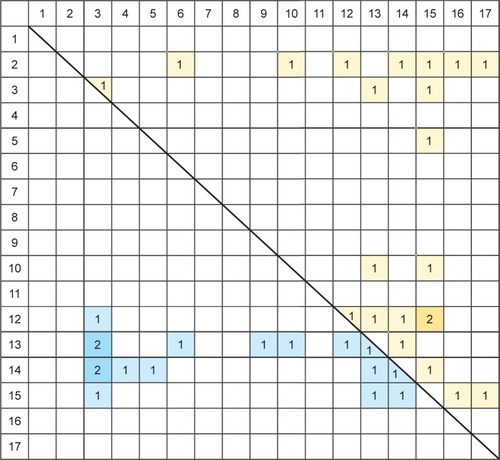
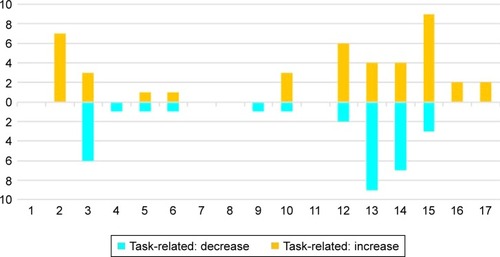
Figure 5 Histogram of the 17 regions found in fMRI/task-related studies showing the number of studies that found a region to have an altered FC with another region.
Abbreviations: FC, functional connectivity; fMRI, functional magnetic resonance imaging; MDD, major depressive disorder.