
Figures & data
Table 1 Comparison of demographic characteristics and risk factors of stroke between the two groups
Figure 1 P2Y12 gene electrophoretogram.
Notes: M denotes the indicator “Mark”: the index strip from top to bottom is 250 bp, 220 bp, 200 bp, 170 bp and 150 bp. (1 and 6) The PCR product: 230 bp. (2) H1/H1: 197 bp; (3 and 5) H1/H2: 197 bp and 157 bp. (4) H2/H2: 157 bp. Magnification 1:1.
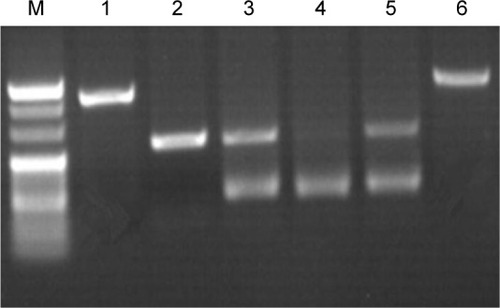
Table 2 Frequency comparison of the H1/H2 polymorphism of the P2Y12 gene between CI and contrast groups
Table 3 Multivariate logistic regression analysis with CI as the dependent variable
Table 4 The genotype distribution of the Hardy–Weinberg equilibrium in the two groups