Figures & data
Table 1 Demographic and clinical characteristics
Figure 1 Flow chart of the participants through the randomized trial.
Abbreviations: CBT, cognitive behavioral therapy; SCM, self-care management; UC, usual care.
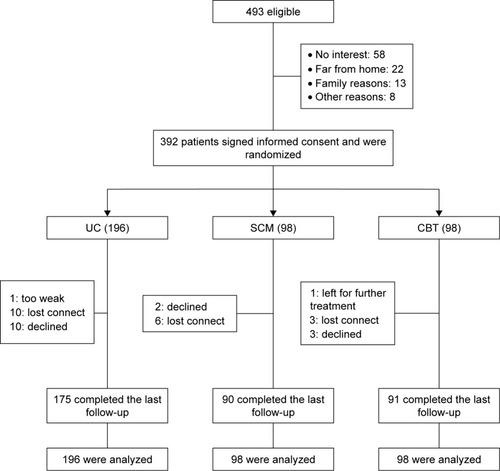
Table 2 RM-ANOVA for scores of AIS, total FACT-B, and five subscales of QOL among three groups
Figure 2 Mean score of AIS at baseline, 4, 12, and 24 weeks.
Abbreviations: AIS, Athens Insomnia Scale; CBT, cognitive behavioral therapy; SCM, self-care management; UC, usual care.
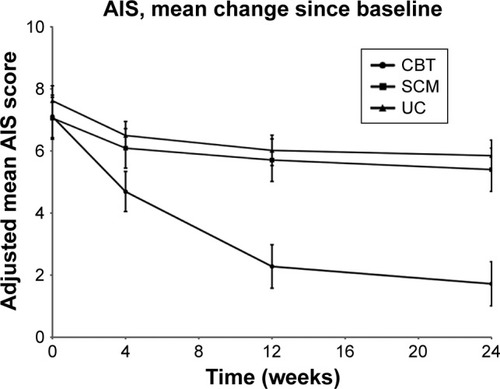
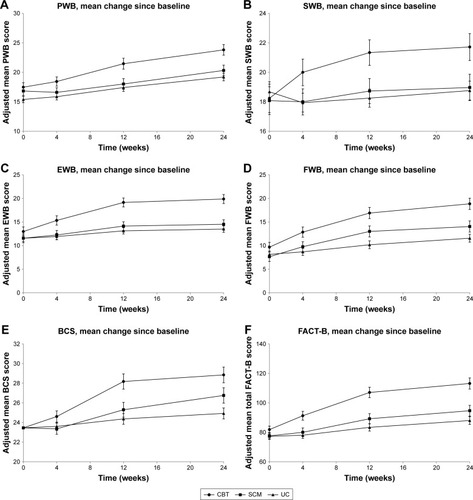
Figure 3 Mean scores of FACT-B subscales (A–E) and overall QOL (F) at baseline, 4, 12, and 24 weeks.
Abbreviations: BCS, breast cancer-specific concerns; CBT, cognitive behavior therapy; EWB, emotional well-being; FACT-B, Functional Assessment of Cancer Therapy-Breast; FWB, functional well-being; PWB, physical well-being; QOL, quality of life; SCM, self-care management; SWB, social well-being; UC, usual care.