Figures & data
Table 1 Demographics and clinical measurements of SA and HC groups
Table 2 Brain areas with significantly different ALFF values between groups
Figure 1 Spontaneous brain activity in the SA and HC groups.
Notes: (A) The different ALFF regions between the SA and HC groups. (B) Significant differences of brain activity in cerebrum. (C) Significant differences of brain activity in cerebellum. The red regions indicate higher ALFF values, and the blue regions imply lower ALFF values (P<0.05, AlphaSim corrected, cluster size >40).
Abbreviations: ALFF, amplitude of low-frequency fluctuation; HC, healthy control; L, left; R, right; SA, strabismus with amblyopia.
Abbreviations: ALFF, amplitude of low-frequency fluctuation; HC, healthy control; L, left; R, right; SA, strabismus with amblyopia.
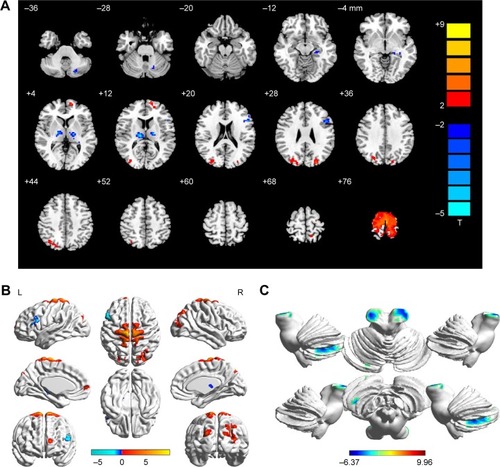
Figure 2 The mean ALFF values between the SA and HC groups.
Abbreviations: ALFF, amplitude of low-frequency fluctuation; BPCG, bilateral precentral gyrus; HC, healthy control; LC, left cuneus; LCPL, left cerebellum posterior lobe; LMFG, left middle frontal gyrus; LT, left thalamus; RPC, right precuneus; RSFG, right superior frontal gyrus; RT, right thalamus; SA, strabismus with amblyopia.
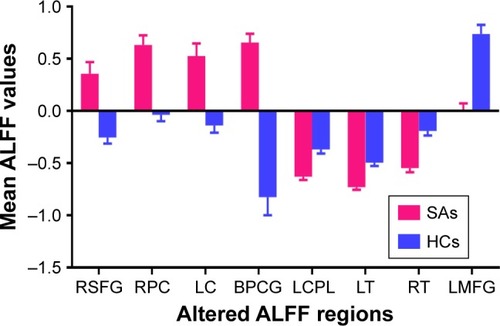
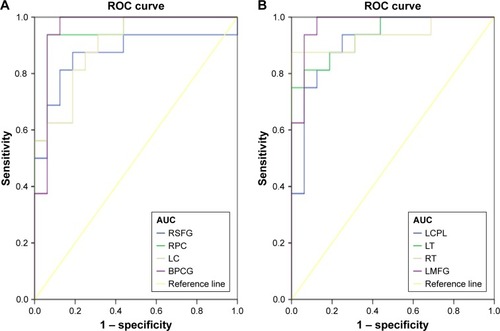
Figure 3 ROC curve analysis of the mean ALFF values for altered brain regions in SA group.
Notes: (A) The area under the ROC curve were 0.871, (P<0.001; 95% CI: 0.734–1.000) for RSFG, RPC 0.949 (P<0.001; 95% CI: 0.874–1.000), LC 0.898 (P<0.001; 95% CI: 0.795–1.000), BPCG 0.957 (P<0.001; 95% CI: 0.879–1.000) (SAs > HCs). (B) The area under the ROC curve were 0.914 (P<0.001; 95% CI: 0.815–1.000) for LCPL, LT 0.938 (P<0.001; 95% CI: 0.859–1.000), RT 0.938 (P<0.001; 95% CI: 0.845–1.000), LMFG 0.973 (P<0.001; 95% CI: 0.922–1.000) (SAs < HCs).
Abbreviations: ALFF, amplitude of low-frequency fluctuation; AUC, area under the curve; BPCG, bilateral precentral gyrus; HC, healthy control; LC, left cuneus; LCPL, left cerebellum posterior lobe; LMFG, left middle frontal gyrus; LT, left thalamus; ROC, receiver operating characteristic; RPC, right precuneus; RSFG, right superior frontal gyrus; RT, right thalamus; SA, strabismus with amblyopia.
Abbreviations: ALFF, amplitude of low-frequency fluctuation; AUC, area under the curve; BPCG, bilateral precentral gyrus; HC, healthy control; LC, left cuneus; LCPL, left cerebellum posterior lobe; LMFG, left middle frontal gyrus; LT, left thalamus; ROC, receiver operating characteristic; RPC, right precuneus; RSFG, right superior frontal gyrus; RT, right thalamus; SA, strabismus with amblyopia.