Figures & data
Table 1 Systematic review of the genetic association of Val66Met and SB, characteristics of the studies included
Figure 1 Procedures and data analysis.
Notes: (A) Flowchart showing study inclusion and exclusion details. (B) Forest plot of a homozygous model in the overall population. (C) Begg’s funnel plot analysis of publication bias in homozygous models in the overall population. (D) Forest plot of a dominant model in European populations.
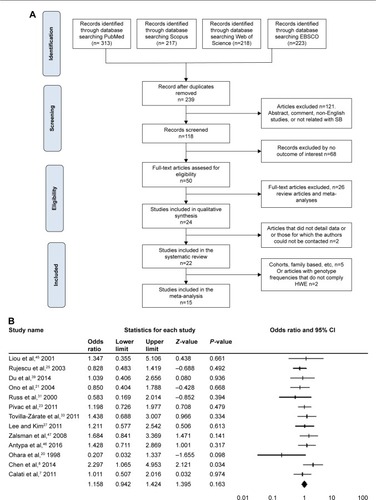
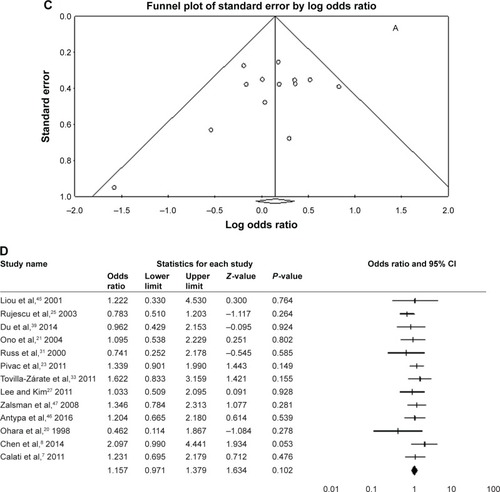
Table 2 Meta-analysis results comparing inherence models between cases and controls
Figure 2 Meta-regression analysis based on mean age.
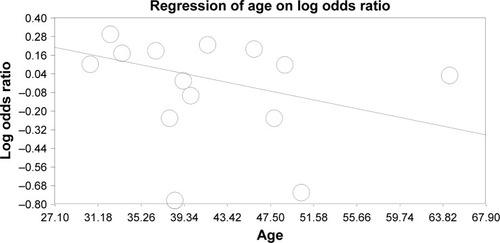
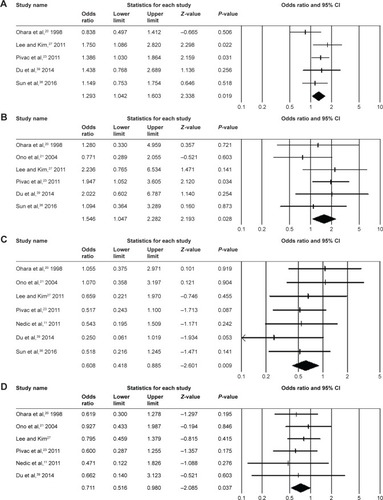
Figure 3 Data analysis.
Notes: (A) Forest plot of allelic model in Asian populations. (B) Forest plot of the recessive model in Asian populations. (C) Forest plot of the heterozygous model in suicide attempters. (D) Begg’s funnel plot analysis of publication bias in the heterozygous model in suicide attempters.
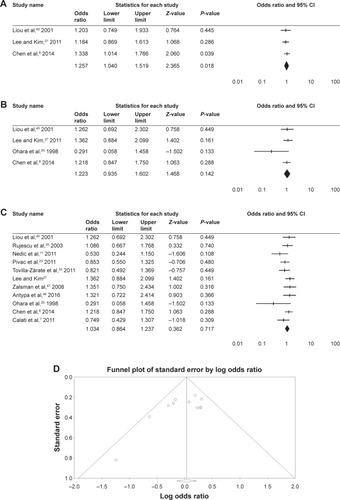
Figure 4 Forest plot in the (A) male group in the allelic model, (B) male group in the homozygous model, (C) female group in the dominant model, (D) female group in the recessive model.