
Figures & data
Figure 1 Timing of VAS, USS and POMS relative to MIP.
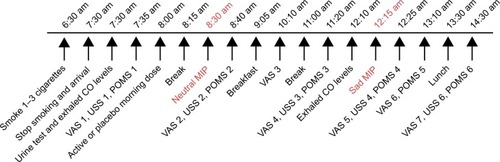
Table 1 Demographic and clinical characteristics
Figure 2 Significant increase in VAS depressed mood scores after the sad MIP during supplement (mean ± SD: 1.56±2.09 cm, t[20]=3.43) and Placebo (mean ± SD: 1.12±1.81 cm, t[20]=2.84) but no effect of dietary supplement in reducing vulnerability to sad mood after sad MIP compared to placebo (rmANOVA: F[1,19]=0.56, P=0.47).
![Figure 2 Significant increase in VAS depressed mood scores after the sad MIP during supplement (mean ± SD: 1.56±2.09 cm, t[20]=3.43) and Placebo (mean ± SD: 1.12±1.81 cm, t[20]=2.84) but no effect of dietary supplement in reducing vulnerability to sad mood after sad MIP compared to placebo (rmANOVA: F[1,19]=0.56, P=0.47).](/cms/asset/768ea9cf-84a8-4b4e-865e-1dc0a4f600dd/dndt_a_172334_f0002_b.jpg)
Figure 3 Significant increase in USS scores after sad MIP during supplement (mean ± SD: 0.63±0.83, t[20]=3.50) and placebo (mean ± SD: 0.45±0.68, t[20]=3.04) with no differences between the groups for change in USS scores (rmANOVA: F[1,19]=0.72, P=0.41).
![Figure 3 Significant increase in USS scores after sad MIP during supplement (mean ± SD: 0.63±0.83, t[20]=3.50) and placebo (mean ± SD: 0.45±0.68, t[20]=3.04) with no differences between the groups for change in USS scores (rmANOVA: F[1,19]=0.72, P=0.41).](/cms/asset/873f9e2d-6efe-4fa8-be7e-0ad9f522b318/dndt_a_172334_f0003_b.jpg)
Figure 4 Significant correlation between the change in VAS depressed mood scores on both active study visits (Pearson r=0.57, P=0.007, R2=0.32). B (degree of slope) in regression is 0.54.
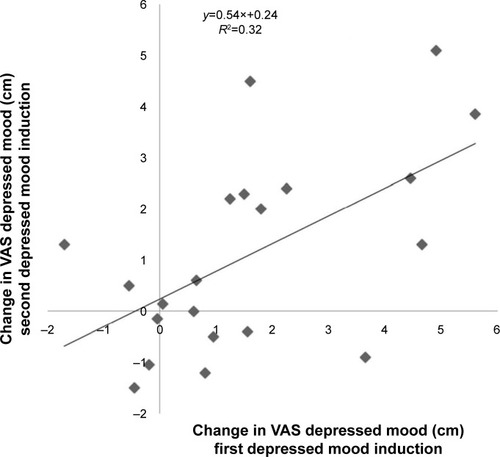
Figure S1 Visual analog scale (VAS) mood scores in subjects receiving active dietary supplement and placebo. The sad mood induction procedure was done between time points 4 and 5. (Time points correspond to: 1=7:35 am, 2=8:40 am, 3=10:10 am, 4=11:20 am, 5=12.25 pm, 6=13:10 am, 7=14:30) (Data shown as mean and standard error).
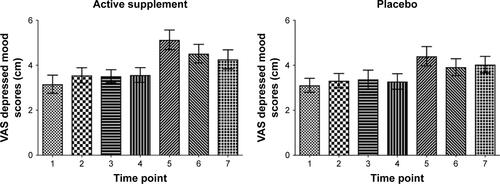
Figure S2 Urge to smoke scale (USS) scores in subjects receiving active dietary supplement and placebo. The sad mood induction procedure was done between time points 3 and 4. (Time points correspond to: 1=7:35 am, 2=8:40 am, 3=11:20 am, 4=12.25 pm, 5=14:30 pm) (Data shown as mean and standard error).
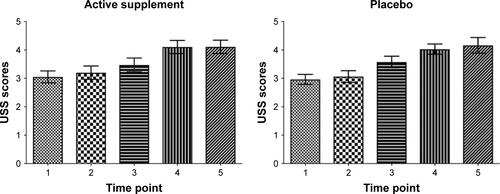
Figure S3 Significant increase in profile-of-mood-state (POMS) scale depression/dejection score after sad mood induction procedure (MIP) during supplement (mean ± SD: 2.95±4.57, t[20]=2.95, P=0.008) and placebo (mean ± SD: 2.19±3.37, t[20]=2.98, P=0.007), but no effect of dietary supplement in reducing vulnerability to sad MIP compared to placebo conditions (F[1,19]=0.002, P=0.97).
![Figure S3 Significant increase in profile-of-mood-state (POMS) scale depression/dejection score after sad mood induction procedure (MIP) during supplement (mean ± SD: 2.95±4.57, t[20]=2.95, P=0.008) and placebo (mean ± SD: 2.19±3.37, t[20]=2.98, P=0.007), but no effect of dietary supplement in reducing vulnerability to sad MIP compared to placebo conditions (F[1,19]=0.002, P=0.97).](/cms/asset/6f5fa356-1f59-4aeb-abc6-4daa70e01823/dndt_a_172334_sf0003_b.jpg)