Figures & data
Figure 1 Flowchart depicting the literature search and study selection.
Notes: After removal of duplicates, reviews, and quality control, six papers were suitable for analysis.
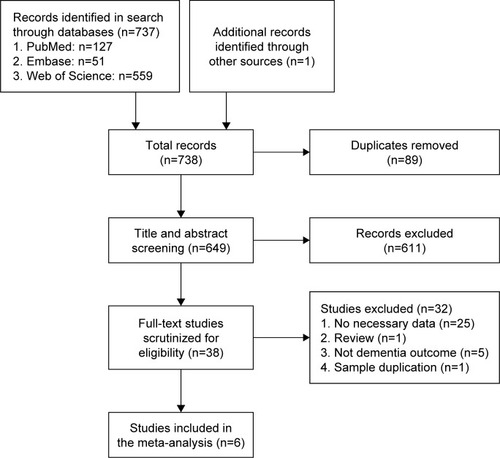
Table 1 Characteristics of studies included in this meta-analysis
Table 2 Quality scores of included studies
Figure 2 Meta-analysis of the association between schizophrenia and dementia incidence. The random-effects model was used. There was a highly significant difference between the two groups (P=0.002).
Note: Weights are from random effects analysis.
Abbreviation: RR, relative risk.
Abbreviation: RR, relative risk.
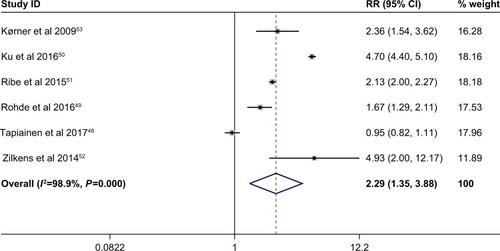
Figure 3 Analyses of subgroups relating schizophrenia to dementia. The random-effects model was applied.
Abbreviation: RR, relative risk.
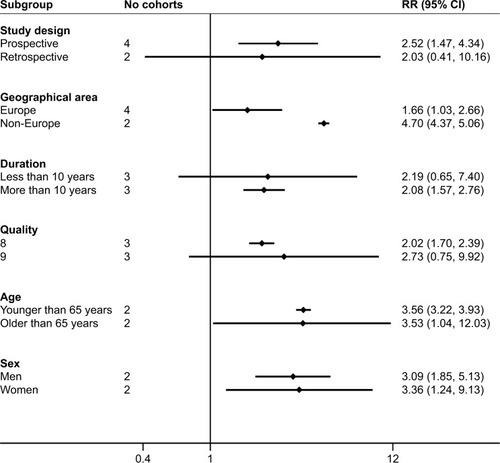
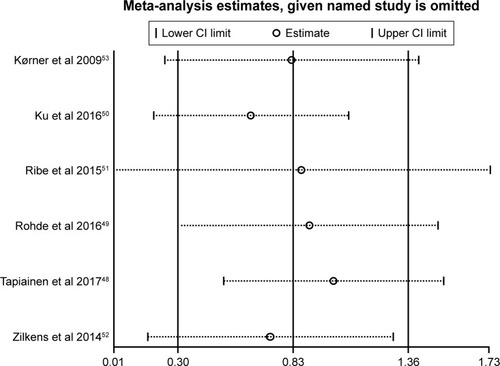
Figure 4 Sensitivity analyses results when the given named study was omitted.