
Figures & data
Figure 1 Study flow diagram: enrollment to analysis.
Abbreviation: MTCC, mindfulness-based Tai Chi Chuan.
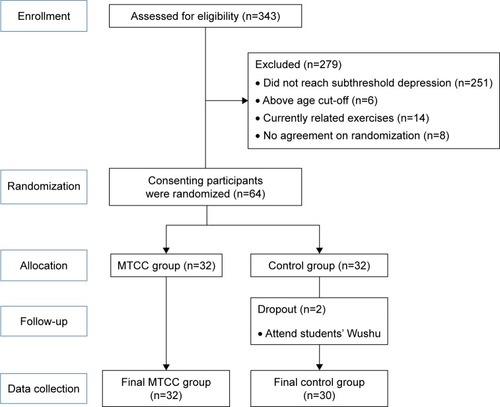
Table 1 Comparison of two groups on PHQ-9, MAAS, and CPSS
Table 2 Pre–post comparison of independent group on PHQ-9, MAAS, and CPSS
Table 3 Pre–post comparison of two groups on PHQ-9, MAAS and CPSS
Table 4 Depression outcome by groups after intervention (n=62)