
Figures & data
Figure 1 Consort diagram of the study.
Abbreviation: Y-BOCS, Yale-Brown Obsessive–Compulsive Scale.
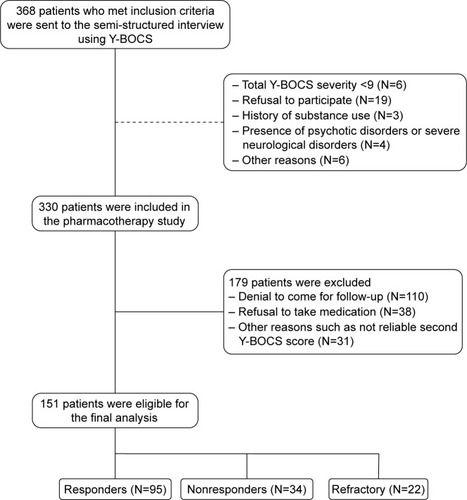
Table 1 Clinical variables of patients in each treatment response classes
Table 2 Accuracy, sensitivity, and specificity of different classification algorithms applied on the current OCD data set based on 20 repetitions of 10-fold cross-validation
Table 3 TP, FP, FN, and TN values for each treatment response class resulted from some algorithms and new method
Table 4 Accuracy, sensitivity, and specificity of each of class resulted from the new method